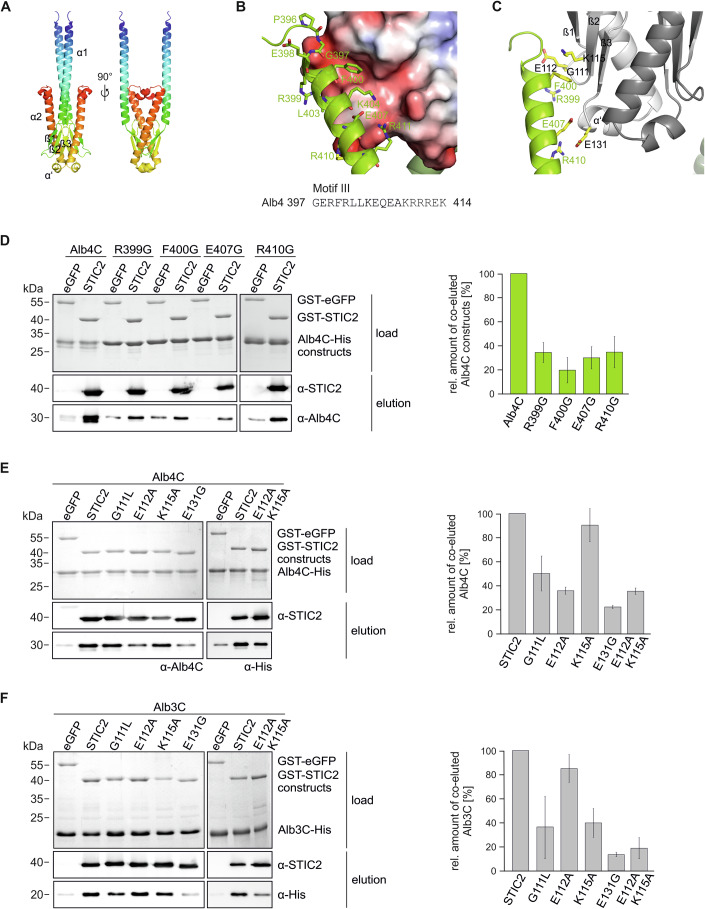
Figure 6. Characterization of the interaction interface between STIC2 and the C-terminal region of Alb4 and Alb3.
(A) Alphafold-Multimer Model of the STIC2 dimer. STIC2 is shown in two orientations in cartoon representation with rainbow coloring from blue to red. (B) Interaction of Alb4 Motif III with STIC2. Shown is the STIC2 electrostatic surface (Connolly surface colored with APBS potential from red to blue (−4 to +4 kJ/mol/e)) together with a cartoon representation of Alb4C in green. Residues of Alb4 within 4 Å of STIC2 are shown as sticks and labeled. (C) Interacting residues investigated in the study. Shown is STIC2 as gray cartoon model (monomer A, light gray, monomer B darker gray), Alb4C as green cartoon. Interacting residues characterized experimentally are shown as yellow sticks and labeled. (D–F) Pull-down experiments using purified GST-STIC2 and Alb4C variants are shown in (D) or the indicated GST-STIC2 point mutation variants and Alb4C (E) or Alb3C (F). GST-eGFP was used as a control. Assays were conducted using glutathione sepharose beads. Load samples are shown by Coomassie stained SDS-Gels. Eluates were analyzed by SDS-PAGE and subsequent immunoblotting using the indicated antibodies. Coelution was quantified using ImageJ. Means and SDs were calculated from three independent experiments. Source data are available online for this figure.

