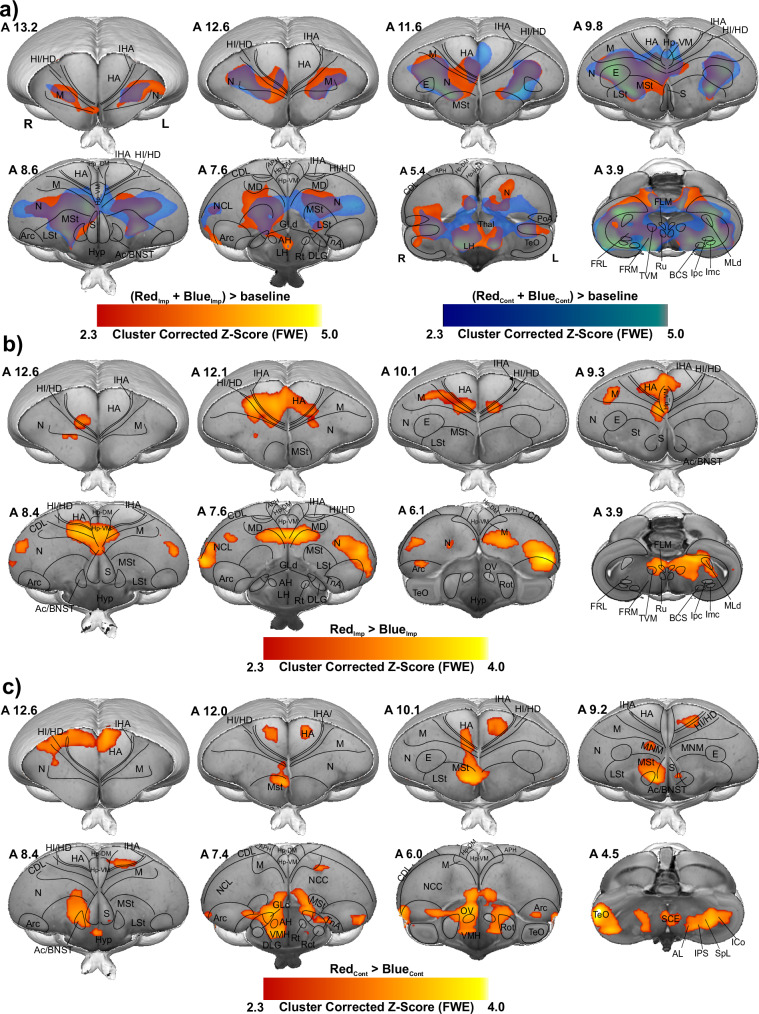
Fig. 2. Colour preference of different groups.
a GLM analysis was used to demonstrate activated networks during imprinting and control trials by examining RedImp + BlueImp > baseline (red map) and BlueCont + RedCont > baseline (blue map) contrasts. The colour maps show the activation significance of group-averaged data from 17 chicks (9 red groups + 8 blue groups) in the axial view (group analysis using a mixed model FLAME 1 + 2 method, Z = 2.3, and p < 0.05 FEW corrected at the cluster level). b the contrast map shows the significant increase of BOLD signal during Red colour as imprinting stimulus compared to Blue colour as imprinting stimulus (RedImp > BlueImp contrast, 9 chicks for red group and 8 chicks for blue group). c Activation map showing the strong BOLD response during the Red colour as control stimulus for the blue group compared to the Blue colour as control stimulus for red group (BlueCont < RedCont, 9 chicks for red group and 8 chicks for blue group). The functional maps were superimposed on the high-resolution anatomical data at the different levels of an ex vivo chick brain (in grayscale).

