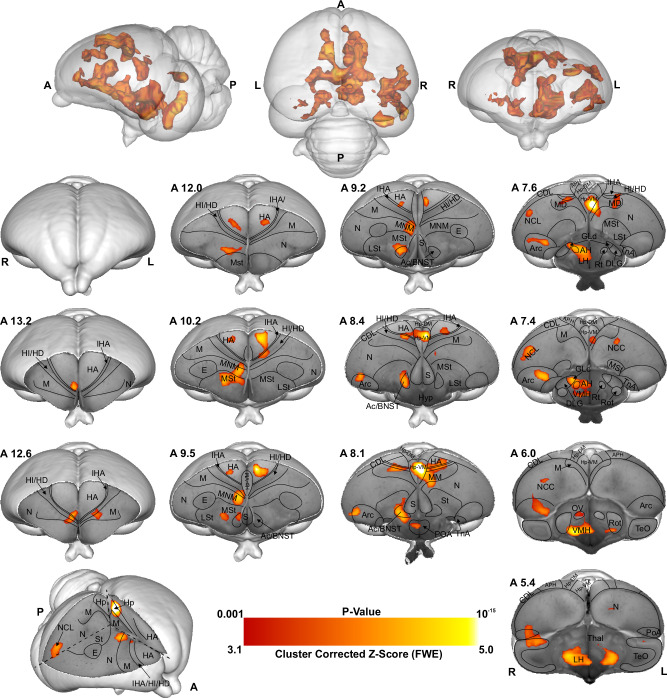
Fig. 5. BOLD response pattern during imprinting memory retrieval.
The high-resolution coronal slices at the different levels of an ex-vivo chick brain are in greyscale, while the contrast map represents the activation pattern during the presentation of the preferred imprinting object after imprinting learning has already occurred (Red group, the contrast of red light versus blue light conditions, n = 9, Z = 3.1 and p < 0.05 FEW corrected at the cluster level). The top row images show the 3D representation of the activation pattern inside a translucent chick brain. A 3D depiction of the chick brain is represented bottom left with an example window at the level of A 7.4. Anatomical borders (black lines) are based on the contrast difference of ex-vivo chick brain and Chick atlas101,102. The corresponding abbreviations of ROIs are listed in Supplementary Table 2.

