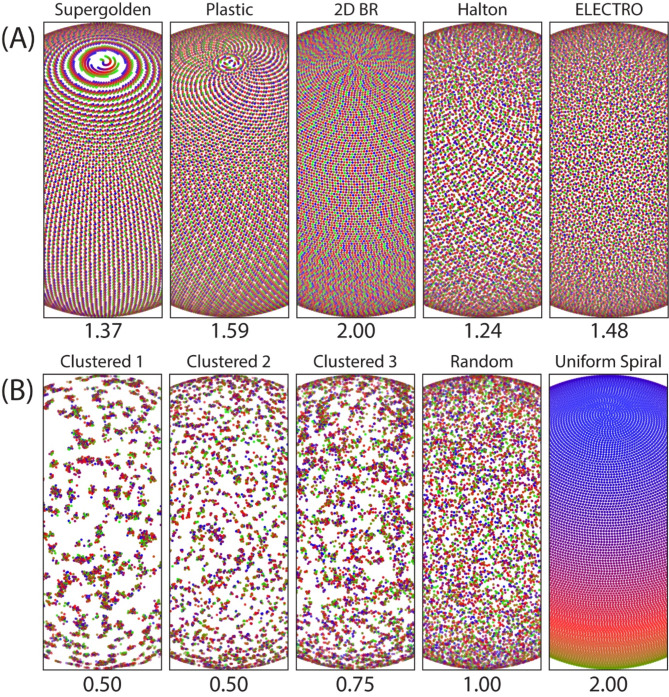
Fig. 1.
Points on the sphere represent the readout directions for 3D center-out radial trajectories. The blue-red-green colormap indicates the order of readouts. A narrow view of the sphere is shown since point patterns mainly vary as a function of the polar angle. The Normalized Mean Nearest neighbor Angular distance (NMNA) is used to describe points on the unit sphere (see Methods). A randomly distributed set of points will, on average, produce an NMNA value of 1. Clustered distributions of points will tend to have NMNA values below 1, while higher values indicate points are more evenly spread out. (A) Examples of five different trajectories with 40,000 readouts each. (B) Example point distributions with different values of NMNA.

