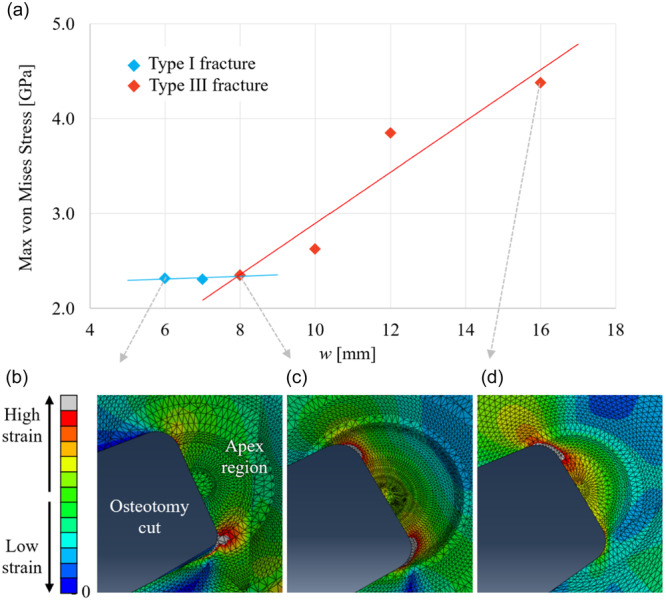
Figure 5.

Prediction of failure from Part 2 of the finite element analysis study using the ‘strain at the apex’ classification method. (a) Variation of maximum stresses at the apex (stress in GPa on the y‐axis) with lateral hinge width (in mm on the x‐axis) for hinge height h = 8 mm, demonstrating the increased likelihood of a type III fracture with a wider hinge width. (b) Apex strains showing type I fracture for w = 6 mm. (c) Apex strains showing type I or type III fracture for w = 8 mm. (d) Apex strains showing type III fracture for w = 16 mm.
