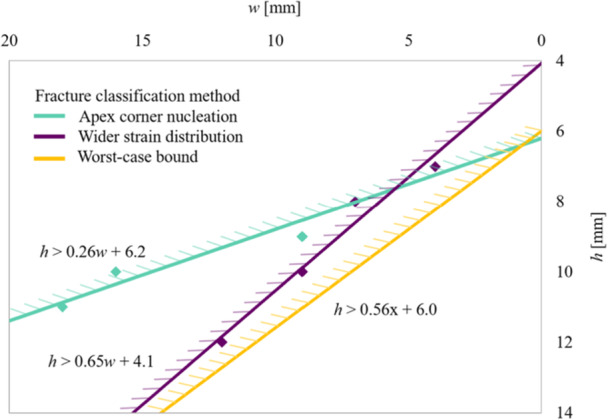
Figure 6.

Graph (hinge width w in mm on the x‐axis; hinge height h from the tibial plateau in mm on the y‐axis) demonstrating the predicted type I to III transition bounds for the two different fracture classification methods. The region where a type III fracture is avoided lies to the bottom right of the figure, with a smaller lateral hinge width (smaller w) and with the apex further from the tibial plateau (larger h). The bottom line shows a conservative bound capturing the worst case for both fracture classification methods. Note that the x‐axis has been reversed so that the relative locations on this graph correspond to the physical locations on the tibia illustrations in this study.
