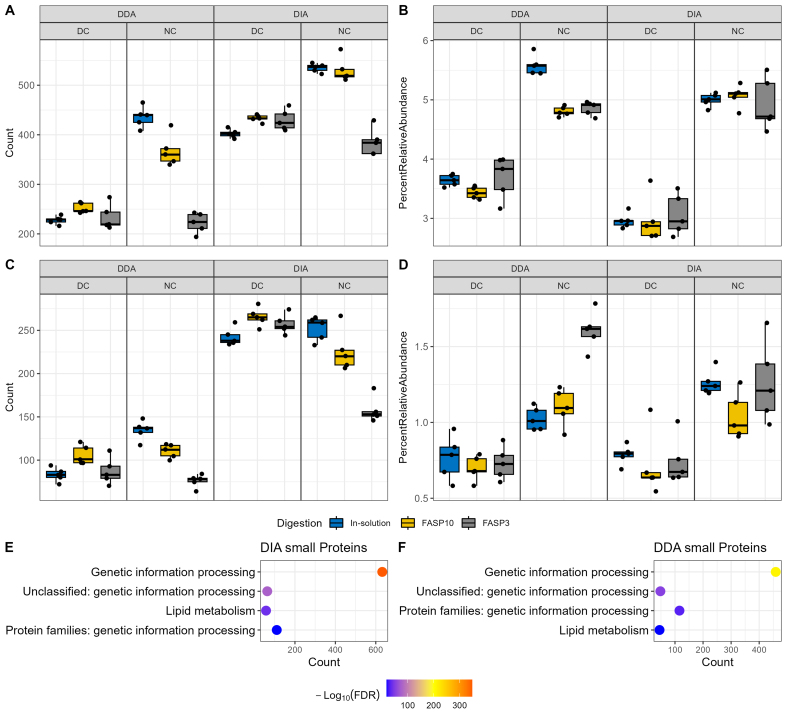
Figure 3.
Quantitation of small proteins and antimicrobial peptides in mouse fecal samples. (A) Count and (B) relative abundance of small proteins in samples using a 100 amino acid cut-off. Functional enrichment analysis of identified small proteins in (C) the DDA-PASEF dataset and (D) the DIA-PASEF dataset, using all identified proteins as background in DDA and DIA datasets, respectively. Functional annotation was performed using GhostKOALA, and only significantly enriched functions were shown (adjusted P value ≤ 0.05). (E) Count and (F) relative abundance of AMPs when searched against the AMPsphere database. Facet_grid function in ggplot2 was used to generate different sections; DC and DDA groups are on the left side, while NC and DIA on the right side. DDA: Data-dependent acquisition; PASEF: parallel accumulation-serial fragmentation; DIA: data-independent acquisition; AMPs: antimicrobial peptides; DC: differential centrifugation.

