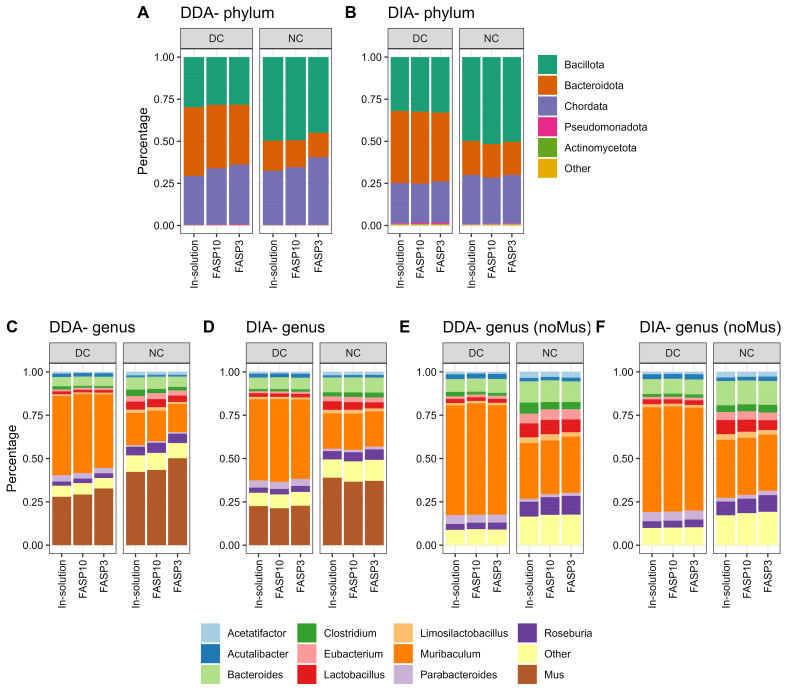
Figure 4.
Taxonomic profiles of mouse fecal metaproteome. (A and B) Phylum level, (C and D) genus level with host (Mus), or (E and F) without host were shown. The group mean relative abundance of phyla or genera was used for plotting. Top 5 phyla or top 10 genera were shown, with the remainder grouped as “Other” in the stacked plots. Facet_grid function in ggplot2 was used to generate different sections; DC groups are on the left side and NC on the right side. DC: Differential centrifugation; NC: non-differential centrifugation.

