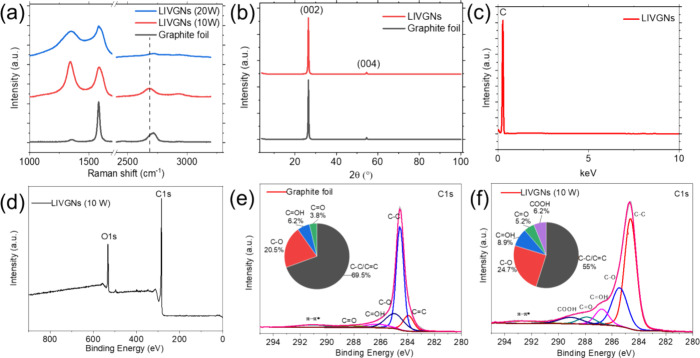
Figure 2.
(a) Raman spectra of the pristine graphite foil (black graph), LIVGNs irradiated with a laser power of 10 W (red spectra), and LIVGNs irradiated with a laser power of 20 W (blue spectra). (b) XRD spectra of the pristine graphite foil (black graph) and LIVGNs (red spectra). (c) EDS spectrum of LIVGNs. (d) XPS spectrum of LIVGNs. (e) C 1s XPS spectrum of the graphite foil. (f) C 1s XPS spectrum of LIVGNs. Area % of components are listed for both samples in the form of inserted chart pies.

