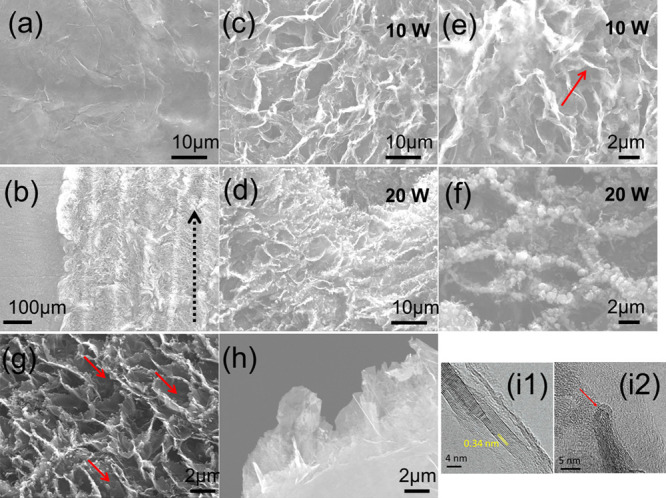
Figure 3.

Microscopic characterization. Top-view SEM images of: (a) pristine graphite foil, (b) reconstructed surface upon irradiation (black arrow indicates the scanning direction), (c,e) LIVGNs irradiated with a laser power of 10 W (red arrow indicates the sharp edges), and (d,f) LIVGNs irradiated with a laser power of 20 W. SEM images of the LIVGNs (g) tilted in 45° (red arrows mark the nanosheet orientation) and (h) tilted in 90°. (i1,2) HRTEM images exposing the lattice fringes and sharp edges of LIVGNs (red arrow indicates the sharp edges, Figure i2).
