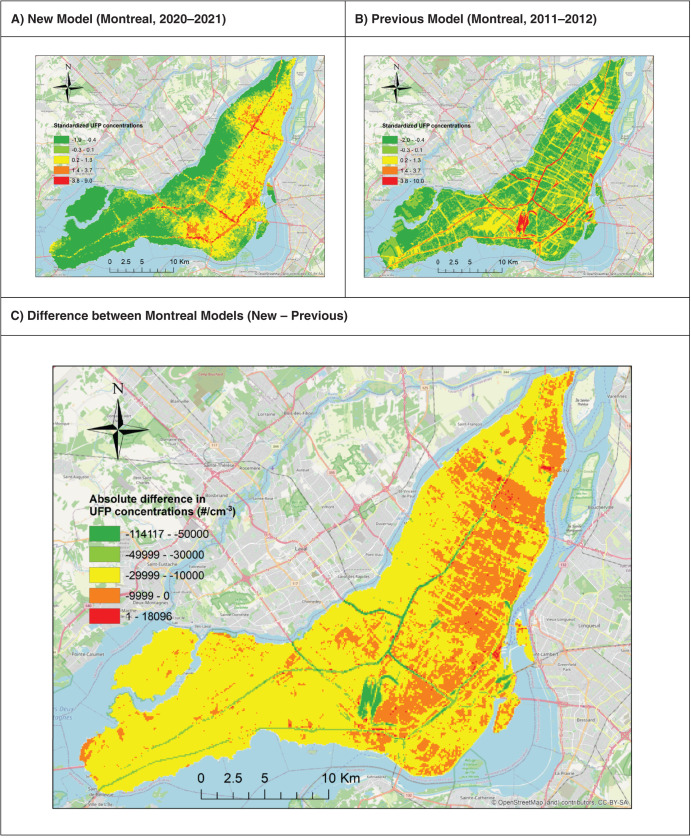
Figure 8.
Comparison of the new model for outdoor UFP number concentrations in Montreal (combined LUR-CNN model without backcasting or mobility weighting) with the previous model based on data collected in 2011–2012 on weekdays during rush-hour periods. Panels A and B show standardized concentrations, and panel C shows the spatial distribution of differences on the original scale. CNN = convolutional neural network; LUR = land use regression; UFP = ultrafine particles.

