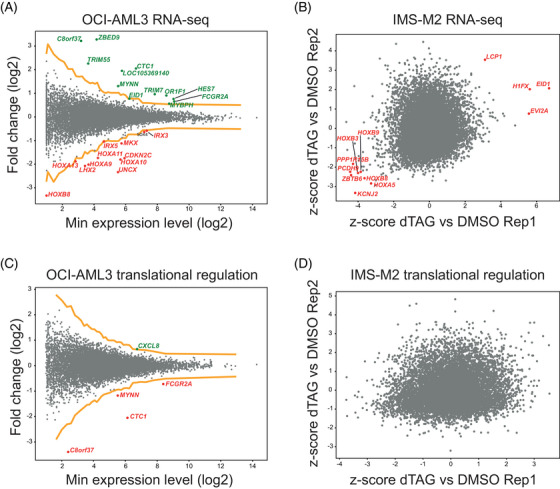
FIGURE 2.

(A) Messenger RNA (mRNA) fold change of OCI‐AML3 degron cells treated for 6 h with dTAG‐13 versus dimethyl sulfoxide (DMSO). The yellow lines represent a z‐score of +4 and −4, respectively. Genes with a z‐score of ≤ ‐4 are highlighted in red, while genes with a z‐score of ≥ 4 are highlighted in green. Single replicate. (B) mRNA fold change of IMS‐M2 degron cells treated for 6 h with dTAG versus DMSO. Genes with a significant average z‐score with a false discovery rate (FDR) of 5% are highlighted in red. Two replicates. (C) Translational efficiency (TE) fold change of OCI‐AML3 degron cells treated for 6 h with dTAG‐13 versus DMSO. The yellow lines represent a z‐score of +4 and −4, respectively. Genes with a z‐score of ≤ ‐4 are highlighted in red, while genes with a z‐score of ≥ 4 are highlighted in green. Single replicate. (D) TE fold change of IMS‐M2 degron cells treated for 6 h with dTAG‐13 versus DMSO. Genes with a significant average z‐score with an FDR of 5% are highlighted in red. Two replicates.
