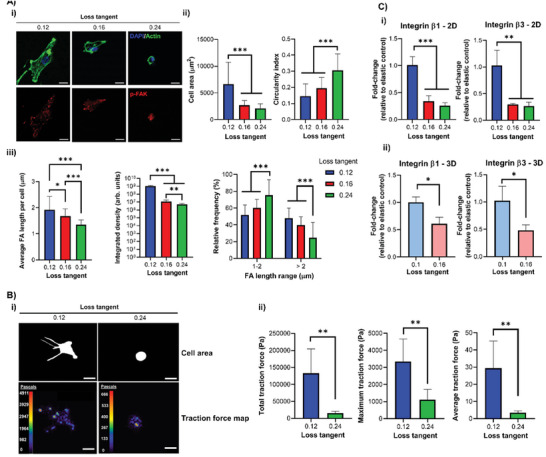
Figure 2.

hMSC adhesion and spreading decrease as the matrix viscous component increases. A‐i) Representative immunofluorescence images of hMSCs cultured for 24 h on 2D PAAm hydrogels with DAPI (blue), actin (green) and p‐FAK (red) staining with ii) quantification of cell area (left) and circularity (right), n = 31–35, and iii) quantification of average FA length per cell (left), p‐FAK signal intensity (middle) and relative frequencies of FAs between 1–2 µm and >2 µm (right), n = 25–50. B‐i) Representative images of the cell mask area and traction stress maps with cell traction stresses (in Pascals) for hMSCs cultured for 24 h on 2D PAAm hydrogels and ii) quantification of the total (left), averaged (middle) and maximum (right) traction stresses, n = 5. C) qPCR data from hMSCs cultured i) on 2D PAAm and ii) in 3D PEG‐MAL gels for 3 days showing fold‐change in gene expression of integrin β1 (left) and β3 (right) relative to control with stronger elastic character (0.12/0.1 loss tangent samples) and normalized to GAPDH, n = 3. For all figures, data are represented as mean ± standard deviation, and differences are considered significant for p ≤ 0.05 using one‐way ANOVA or t‐tests for multiple or pairwise comparisons respectively (* p ≤ 0.05, ** p ≤ 0.01, *** p ≤ 0.001). All hydrogels were functionalized with 2 mm RGD peptide to allow cell adhesion. All PEG‐MAL hydrogels were crosslinked using peptide ratios of 1% VPM and 99% scrambled VPM. Scale bars = 20 µm.
