Figure 5.

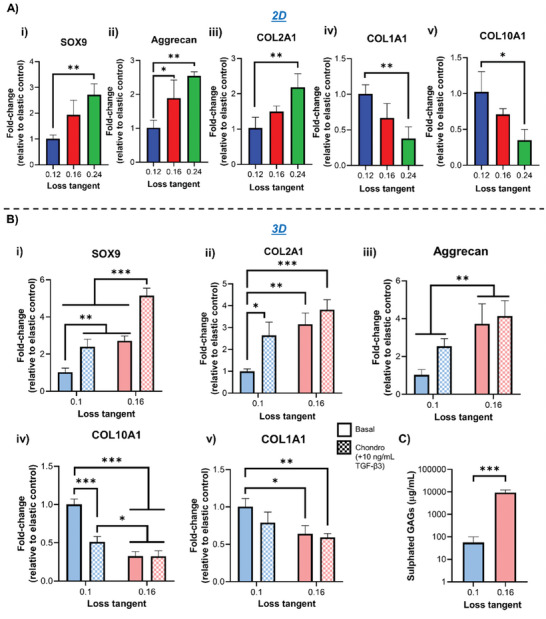
hMSC chondogenesis is promoted in matrices with a higher loss tangent. A) qPCR data showing fold‐change in gene expression from hMSCs following i) 3‐day culture on 2D PAAm hydrogels for SOX9 and ii) 7 days for Aggrecan, iii) COL2A1, iv) COL1A1, and v) COL10A1, n = 3. B) qPCR data showing fold‐change in gene expression from hMSCs cultured in 3D PEG‐MAL hydrogels for i) 3 days for SOX9 and ii) 7 days for Aggrecan, iii) COL2A1, iv) COL1A1, and v) COL10A1, n = 3. Cells were cultured in either basal medium or chondrogenic medium containing 10 ng mL−1 TGF‐β3. C) Sulfated GAG quantification from hMSCs following 3‐week cultures in 3D PEG‐MAL hydrogels, n = 3. For all figures, data are represented as mean ± standard deviation, and differences are considered significant for p ≤ 0.05 using one‐way ANOVA and t‐tests for multiple and pairwise comparisons respectively (* p ≤ 0.05, ** p ≤ 0.01, *** p ≤ 0.001). All hydrogels were functionalized with 2 mm RGD peptide to allow cell adhesion. All qPCR data was made relative to control sample with stronger elastic character (0.12/0.1 loss tangent) and normalized to GAPDH. All PEG‐MAL hydrogels were crosslinked using peptide ratios of 1% VPM and 99% scrambled VPM.
