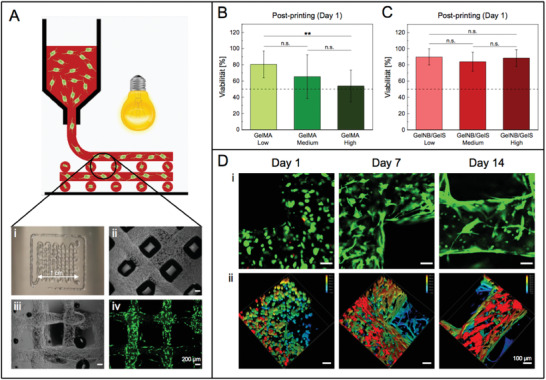
Figure 6.

A) 3D bioprinting of a hydrogel grid structure (1 cm × 1 cm) consisting of four layers on a glass slide. Post‐printing cell viability analysis of 3D bioprinted NHDF at day 1 using B) GelMA (Low, Medium, High) and C) GelNB/GelS (Low, Medium, High) bioinks. Viability was determined by the percentage of live cells over the total cell count (Python software). Data were presented as mean ± SD and statistically evaluated by one‐way ANOVA. *, **, *** represent p < 0.05, 0.01, and 0.001, respectively. D) i) Live/dead staining with calcein‐AM (green, live cells) and propdium iodide (red, dead cells) of 3D bioprinted NHDF in the GelNB/GelS (Medium) bioink 1, 7, and 14 days post‐printing, followed by confocal microscopy (Leica TCS SPE, scale bar 100 µm). ii) Distribution of NHDF within the hydrogel along the z‐axis (depth coding, z‐stacks of 300 µm).
