Figure 4.

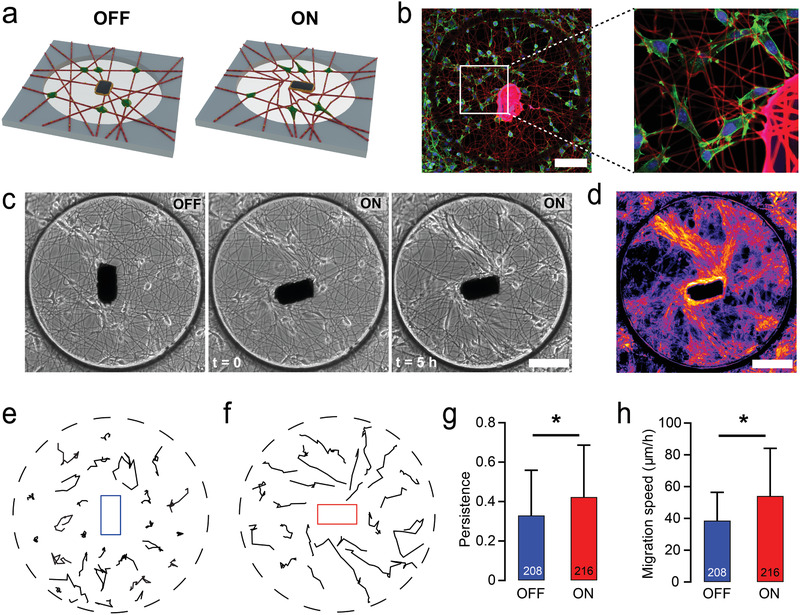
Local matrix alignment by the µ‐actuator influences cell migration speed, directionality, and persistence. a) Schematics illustrating the local actuation of the fiber network seeded with fibroblasts (green). b) Fibroblasts adhere to the RGD‐coupled fibers, spread, and migrate. Cells were counter‐stained for F‐actin (green) and nuclei (blue) with phalloidin and Hoechst 33342, respectively. The glue polymerized around the µ‐actuator shows autofluorescence in the red channel. c) Temporal sequence of phase‐contrast images shows the increasing density of fibroblasts migrating along the aligned fibers. d) Heat map of the overlay of microscopy images taken every 15 min for 6 h highlight the cell trajectories. e,f) Representative fibroblast migration tracks over a 6 h time course on non‐actuated (e) and actuated (f) fiber networks. g,h) Key characteristics of cell migration such as persistence (g) and migration speed (h) increase with the local actuation. All data presented as mean s.d. and * indicates a statistically significant comparison with p < 0.05 (two‐way analysis of variance). Scale bars: 100 µm.
