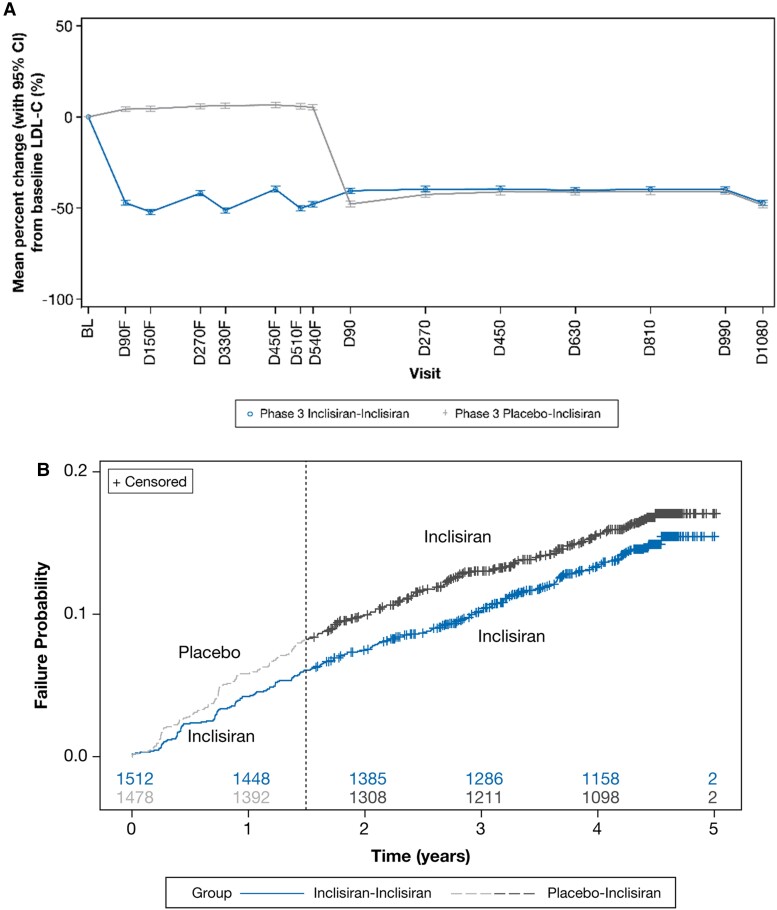
Figure 5.
Exploratory analysis of change in LDL-C and MACE-related safety events. The change in (A) LDL-C and (B) MACE-related safety events. Baseline value of LDL-C was taken from the baseline of the parent trials. To distinguish from visits in ORION-8, the suffix ‘F’ was added to visits in the parent (feeder) trials ORION-9, ORION-10, and ORION-11. The numbers of patients at risk are displayed at the bottom of the Kaplan–Meier plot. The dashed line denotes the transition from the parent trial to ORION-8. BL, baseline; CI, confidence interval; D, Day; LDL-C, low-density lipoprotein cholesterol.

