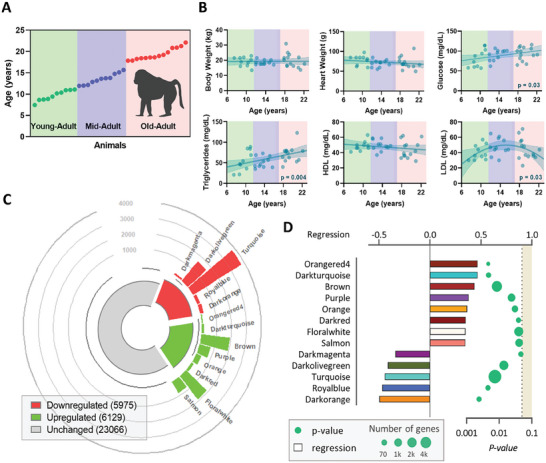
Figure 1.

Aging effects on baboon morphometrics, blood clinical data, and cardiac transcriptomics. A) Schematic representation of the experimental design. B) Variation of morphometric (body and heart weight) and blood clinical (glucose, triglycerides, HDL, and LDL) measurements with age. C) Modules positively, in red, and negatively, in green, correlated with age and number of transcripts in each module. The size of the bar is proportional to the number of transcripts from each module. D) Modules that significantly correlate with age. Each bar is the color of the module and the size represents the regression (top axis), and the dots indicate the module's p‐value (bottom axis) and their size represents the number of transcripts from the respective module.
