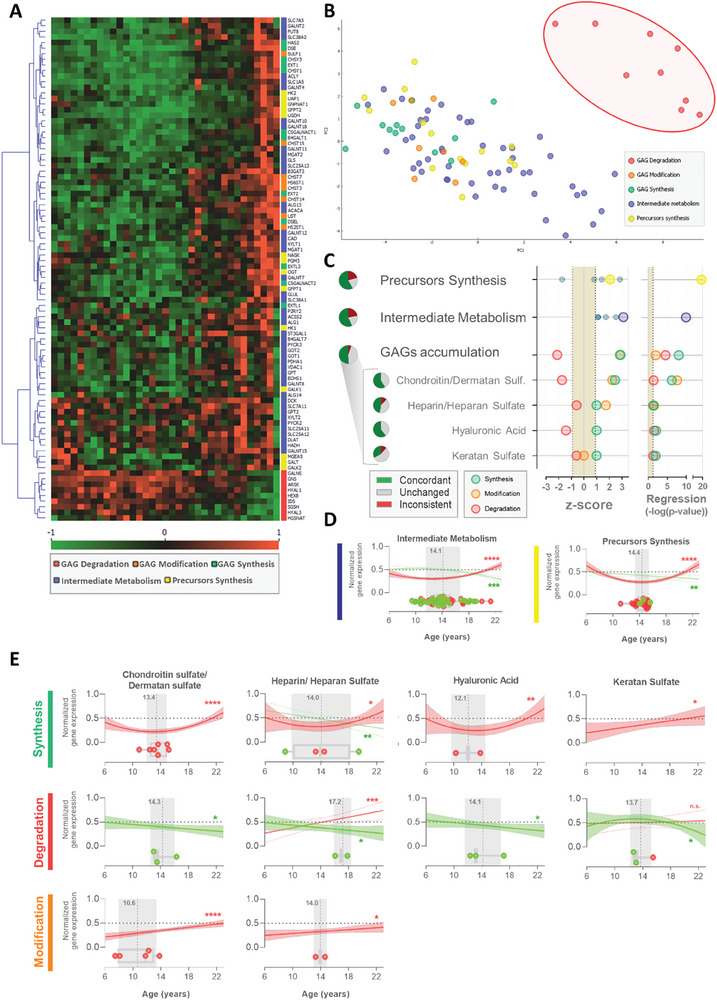
Figure 4.

Glycosaminoglycan‐related pathways transcriptomics in heart with aging. A) Heatmap showing the longitudinal relative gene expression of transcripts related to GAG degradation (red), GAG modification (orange), GAG synthesis (green), intermediate metabolism (blue), and precursors synthesis (yellow). B) Principal component analysis of the age‐associated profile of gene expression. C) Z‐score of the glycosaminoglycan‐related pathways from their transcript expression, percentage of the genes from the pathway with a concordant (green), inconsistent (red) and unchanged (gray) behavior with age, and circles represent the pathway's ‐log(p‐value) of regression. Transcripts associated with GAG synthesis in green circles, with GAG modification in orange circles, and with GAG degradation in red circles. D) Longitudinal profile of the variation of the normalized transcript expression with age for the proteins associated with intermediate metabolism and precursor synthesis, and E) with the synthesis, degradation, and modification of each type of glycosaminoglycan. Boxplots with transcripts tipping points, in red, represent upregulated transcripts, in green downregulated transcripts, and the age of the average tipping point in gray. GAG – glycosaminoglycan; Sulf. – sulfate.
