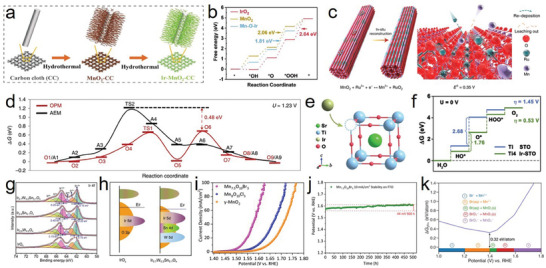
Figure 2.

a) The synthesis procedure for the electrocatalysts. b) Gibbs free‐energy diagram for IrO2, MnO2, and Ir‐MnO2. a,b) Reproduced with permission.[ 27 ] Copyright 2023, Wiley‐VCH. c) Schematic illustration for the in‐situ reconstruction process of Ru/MnO2. E0 represents the standard redox potentials at 298.15 K and a pressure of 1 atm. d) The free energy (ΔG) diagrams of AEM and OPM at 1.23 V versus RHE. States O1–O9 and A1–A9 present the different elementary states in the OPM and AEM pathways, respectively. c,d) Reproduced with permission.[ 28 ] Copyright 2021, Springer Nature. e) Schematic illustration for the incorporation of Ir dopants into the STO matrix. f) Gibbs free energy diagrams for OER on Ti site in STO (blue), and Ti4 site in Ir‐STO (green). e,f) Reproduced with permission.[ 29 ] Copyright 2019, Wiley‐VCH. g) Ir 4f spectra for IrOx, Ir0.8W0.2Ox, Ir 0.9Sn0.1Ox, and Ir0.7W0.2Sn0.1Ox. h) Schematic diagram of band structure for IrOx and Ir0.7W0.2 Sn0.1Ox. g,h) Reproduced with permission.[ 31 ] Copyright 2022, Wiley‐VCH. i) LSV curves of different catalysts at 1 mV s−1 scan rate with iR correction. j) Chronopotentiometry curves (On FTO) of Mn7.5O10Br3 at 10 mA cm−2 (25 °C). k) Calculated Pourbaix decomposition free energy (ΔGpbx) of Mn7.5O10Br3 from the potential 1.0–1.8V vs RHE at pH 0. The projection of ΔG pbx onto the potential axis shows the stable species at the corresponding regions. i–k) Reproduced with permission.[ 36 ] Copyright 2022, Springer Nature.
