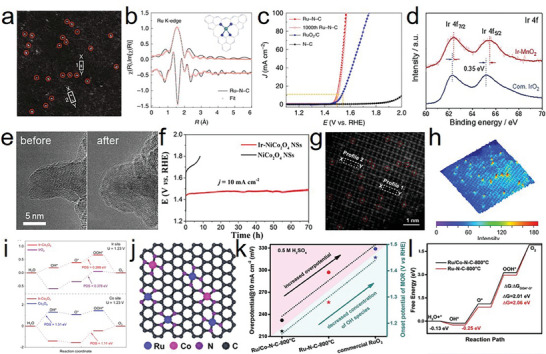
Figure 3.

a) Magnified HAADF‐STEM image of Ru‐N‐C. b) The R‐space curve‐fitting of ex situ Ru‐N‐C. Top and bottom curves are magnitude and imaginary part, respectively. Insert shows the structure of the Ru site in Ru‐N‐C. The balls in gray, blue, and light green represent C, N, and Ru atoms, respectively. c) Electrocatalytic OER performances of the Ru‐N‐C and commercial RuO2/C in 0.5 m H2SO4 electrolyte. a–c) Reproduced with permission.[ 40 ] Copyright 2019, Springer Nature. d) Ir 4f XPS spectrum of Ir‐MnO2 and commercial IrO2. e) HRTEM images of Ir‐MnO2 before and after chronopotentiometry test, no surface amorphization can be seen. d,e) Reproduced with permission.[ 41 ] Copyright 2021, Elsevier. f) Chronoamperometric response of NiCo2O4 and Ir‐NiCo2O4 NSs for OER at 10 mA cm−2 in 0.5 m H2SO4. Reproduced with permission.[ 23a ] Copyright 2020, ACS Publications. g) The enlarged area in HAADF‐STEM, with the Ir single atoms marked in circles. h) 3D atom‐overlapping Gaussian function fitting mapping of the selected area. i) The Gibbs free energy diagrams of the four‐electron OER process on the Ir sites and Co sites of these catalysts under the applied overpotentials of 1.23V vs. RHE, respectively. g–i) Reproduced with permission.[ 43 ] Copyright 2022, Springer Nature. j) Proposed structural model of Ru/Co‐N‐C‐800 °C. k) The relationship between OER performance and the concentration of OH intermediates for Ru/Co‐N‐C‐800 °C, Ru‐N‐C‐800 °C, and commercial RuO2. l) OER free energy diagram for Ru/Co‐N‐C‐800 °C and Ru‐N‐C‐800 °C. j–l) Reproduced with permission.[ 47 ] Copyright 2022, Wiley‐VCH.
