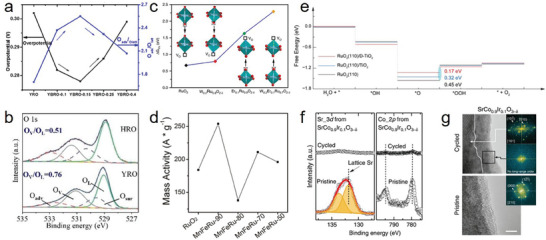
Figure 4.

a) The relationships between overpotential (at 10 mA cm−2) and O‐Vcancies concentration. Reproduced with permission.[ 55 ] Copyright 2020, ACS Publications. b) XPS characterization (O 1s) for HRO and YRO. Reproduced with permission.[ 57 ] Copyright 2022, Royal Society of Chemistry. c) Calculated free energies for oxygen vacancy formation (VO) of different RuO2‐based electrocatalysts, illustrating that the co‐doping of W and Er into the RuO2 lattice is beneficial to suppress oxygen vacancy formation. VO for W0.2Er0.1Ru0.7O2‐δ exceeds the free energy of the redox couple H2O/O2 (1.23 eV) by far, implying that this catalyst is not prone to degradation under the harsh anodic operation conditions in the acidic oxygen evolution reaction (OER). Reproduced with permission.[ 58b ] Copyright 2021, Wiley‐VCH. (d) Lines showing the mass activity of RuO2 and all co‐doped composites at 1.7 V vs RHE. Reproduced with permission.[ 58a ] Copyright 2020, ACS Publications. e) Calculated free‐energy diagrams at 1.5 V for RuO2 (110) (black line) and that supported on either TiO2 (blue line) or D‐TiO2 substrate (red line). Reproduced with permission.[ 54 ] Copyright 2022, ACS Publications. f) Sr 3d and Co 2p XPS for SrCo0.9Ir0.1O3−δ before and after the electrochemical tests. g) HRTEM images of pristine and cycled SrCo0.9Ir0.1O3−δ (by 5 cycles, scale bar, 5 nm). f,g) Reproduced with permission.[ 60 ] Copyright 2019, Springer Nature.
