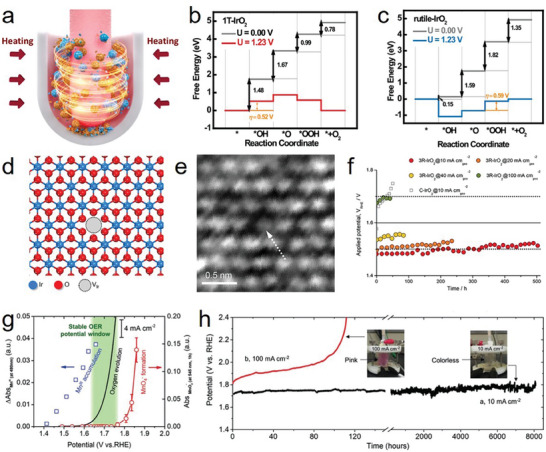
Figure 7.

a) Schematic representation of the mechano‐thermal reactor for preparing 1T‐IrO2, where the mechanical and thermal operations are controlled simultaneously. The blue and yellow balls indicate IrCl3 and KOH, respectively. b) The free energy profile of OER over the 1T‐IrO2. c) The free energy profile of OER over rutile‐IrO2 (110) surface. a–c) Reproduced with permission.[ 110 ] Copyright 2021, Springer Nature. d) High‐magnification STEM‐ADF image further shows the Ir vacancy defect. Reproduced with permission.[ 63 ] Copyright 2021, Elsevier. e) UV/Vis absorption spectra of the electrolyte after 1 h of electrolysis at the indicated potentials. f) Potential dependence of Mn3+ accumulation (blue squares), the oxygen evolution current (black line), and MnO4 −@ generation (red circles). e,f) Reproduced with permission.[ 20b ] Copyright 2019, Wiley‐VCH.
