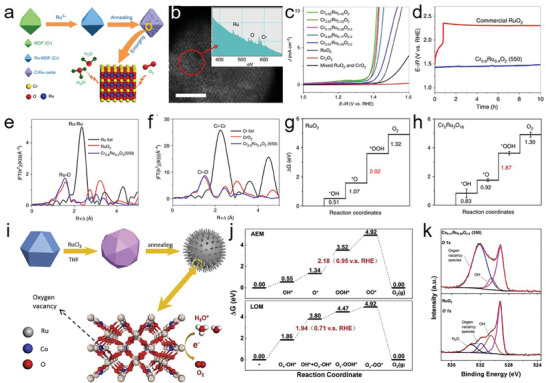
Figure 8.

a) Schematic illustration of the preparation of Cr0.6Ru0.4O2 electrocatalysts. b) atomic‐resolution HAADF‐STEM images and EELS analysis (inset of b), scale bars: 5 nm. c) LSV results of CrxRu1‐xO2‐δ. d) Chronopotentiometry performance under a constant current density of 10 mA cm−2. e) Fourier transformed EXAFS spectra of Ru edge for Cr0.6Ru0.4O2(550), Ru foil, and commercial RuO2. f) Fourier transformed EXAFS spectra of Cr edge for Cr0.6Ru0.4O2(550), Cr foil, and commercial CrO2. g,h) The calculated free energy diagrams for RuO2 and Cr5Ru3O16. a–h) Reproduced with permission.[ 113a ] Copyright 2019, Springer Nature. i) Illustration of the synthesis of Co‐doped RuO2 nanorods. j) The free energy diagrams of the two mechanisms of LOM and AEM. The rate‐determining barriers together with that versus RHE are denoted. k) O 1s XPS profiles of Co0.11Ru0.89O2‐δ (350) and RuO2. i–k) Reproduced with permission.[ 23b ] Copyright 2020, Elsevier.
