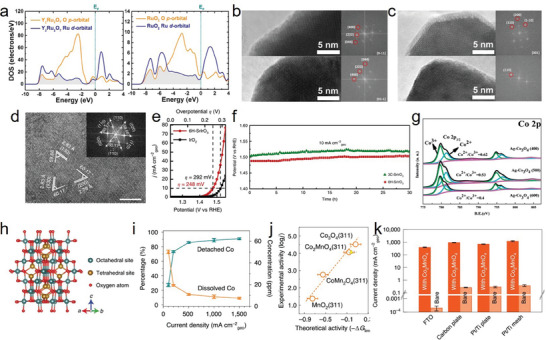
Figure 9.

a) Calculated PDOS plots of Ru 4d and O 2p orbitals for Y2Ru2O7 and RuO2. Shaded area shows the overlapped bands between Ru 4d and O 2p orbitals. The Fermi level is set to zero. b,c) HRTEM micrographs (left) and FFT images of near‐surface region (right), showing the crystalline surface structure of Y2Ru2O7−δ while amorphous surface layer formed on RuO2 catalysts after the cycle tests. a–c) Reproduced with permission.[ 129 ] Copyright 2017, ACS Publications. d) HRTEM image of 6H‐SrIrO3. Scale bar, 5 nm. Inset: the corresponding fast Fourier transform image. e) Polarization curves of 6H‐SrIrO3 and IrO2 in 0.5 m H2SO4 solution with 85% iR‐compensations. The current densities are normalized by the geometric area. f) Chronopotentiometric curves for OER in the presence of 6H‐SrIrO3 and 3C‐SrIrO3 in 0.5 m H2SO4 solution at 10 mA cm−2 geo (without iR compensations). d–f) Reproduced with permission.[ 133 ] Copyright 2018, Springer Nature. g) XPS spectra Co 2p of Ag‐Co3O4(400), Ag‐Co3O4(500) and Ag‐Co3O4(600). Reproduced with permission.[ 65 ] Copyright 2018, Royal Society of Chemistry. h) Crystal structure of Co2MnO4. i) The percentage and concentration of Co that was mechanically detached in solid form (green) or dissolved from the catalyst (brown), after electrolysis in H2SO4 (pH 1). The x‐axis indicates the current density at which electrolysis was performed, and quantification was performed using ICP‐MS after the catalyst was fully deactivated. Data points with error bars were obtained by the standard deviation of at least three independent measurements. j) The correlation between experimental activities (log j) and theoretical ones (–Δ Glim) derived from the ΔG‐limiting energies. A 0.2 eV error bar is shown to describe the theoretical uncertainty and includes the solvation correction, functional with Hubbard U calculations, and system error from DFT calculations. The orange circles indicate the theoretical data based on perfect surfaces, and the yellow‐filled triangle shows the ΔG‐limiting energy of Co2MnO4 as an average with the consideration of all the possible structures. (k) Current densities of Co2MnO4 at 1.8 V vs RHE after iR correction. The activities of the bare substrates are also shown for comparison. Data points with error bars were obtained by the standard deviation of at least three independent measurements. h–k) Reproduced with permission.[ 20a ] Copyright 2021, Springer Nature.
