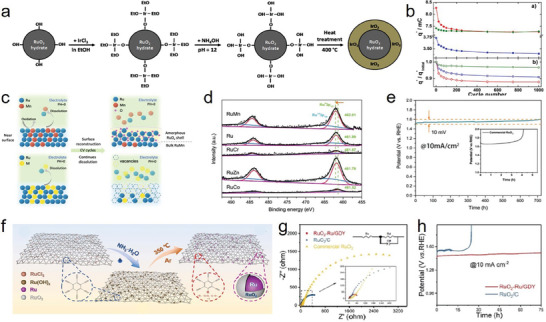
Figure 10.

a) Synthesis Procedure of the Iridium (IV) Oxide Coated on Commercial Ruthenium (IV) Oxide Nanoparticles. b) Charge (q*) evolution (a) and q*/q* initial ratio (b) for RuO2 after heat treatment (blue), IrO2 (red), and IrO2 @RuO2 catalyst (green) electrocatalysts during stability test measurement. a,b) Reproduced with permission.[ 142c ] Copyright 2016, ACS Publications. c) Schematic of surface reconstruction for RuMn and dissolution, for unstable Ru‐based alloys in acidic media during CV cycles. d) XPS spectra of pristine Ru, RuCr, RuCo, RuZn, and RuMn. e) The chronopotentiometry of RuMn and commercial RuO2 at 10 mA cm−2. (c‐e) Reproduced with permission.[ 93 ] Copyright 2022, Wiley‐VCH. f) Schematic illustration of the synthetic route for RuO2‐Ru/GDY. RuCl3/GDY (left). Ru(OH)x/GDY (mid). RuO2‐Ru/GDY (right). g) electrochemical impedance spectroscopy (EIS) of RuO2‐Ru/GDY, RuO2/C, and commercial RuO2. h) Chronopotentiometric curves of RuO2‐Ru/GDY and RuO2/C at a constant current density of 10 mA cm−2. f–h) Reproduced with permission.[ 142a ] Copyright 2022, IOP Publications.
