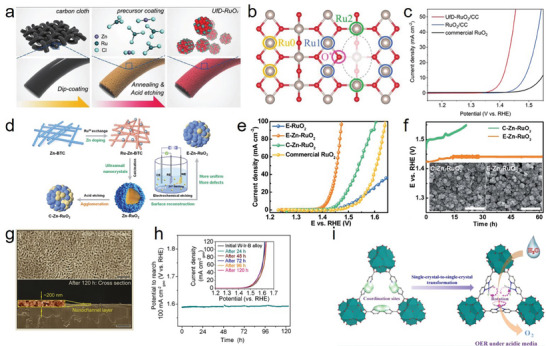
Figure 11.

a) Illustration of the synthetic route for the UfD‐RuO2/CC. b) Top view of defective RuO2 structure. Gray and red spheres present Ru and O atoms, respectively. c) Polarization curves of UfD‐RuO2/CC, RuO2/CC, and commercial RuO2/CC after capacitance‐correction and iR‐correction. a–c) Reproduced with permission.[ 22b ] Copyright 2019, Wiley‐VCH. d) Illustration of the synthetic route for the E‐Zn‐RuO2 and C‐Zn‐RuO2. e) LSV polarization curves of E‐RuO2 (RuO2), E‐Zn‐RuO2, C‐Zn‐RuO2, and commercial RuO2. f) Stability of C‐Zn‐RuO2 and E‐Zn‐RuO2 at 10 mA cm−2; the insets are the morphologies of the two samples after the OER. d–f) Reproduced with permission.[ 115 ] Copyright 2022, Royal Society of Chemistry. g) Surface and cross‐sectional SEM images of the W‐Ir‐B alloy catalyst after the 120 h acidic OER test. The inset shows the magnified cross‐section image of the nanochannel structure (yellow solid box). h) Chronopotentiometry curves of the W‐Ir‐B alloy catalyst in 0.5 m H2SO4 electrolyte at a current density of 100 mA cm−2 geo for 120 h. The inset shows the LSV curves taken periodically during the test (every 24 h). g,h) Reproduced with permission.[ 152 ] Copyright 2021, Springer Nature. i) Schematic illustration of Th‐MOF electrocatalysis. Reproduced with permission.[ 155 ] Copyright 2022, ACS Publications.
