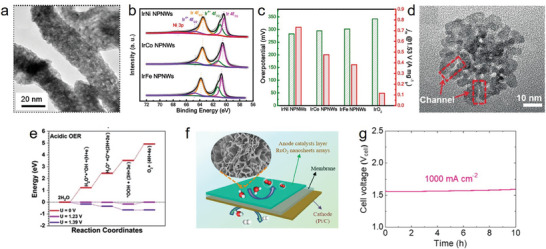
Figure 12.

a) TEM images of the IrNi sample. b) XPS images of Ir 4f for IrM NPNWs. (M = Ni, Co, Fe). c) Bar graph showing overpotential (η) to drive 10 mA cm−2 and mass activity (j m) at 1.53 V vs RHE of the catalysts. a–c) Reproduced with permission.[ 156 ] Copyright 2019, ACS Publications. d) High‐magnification TEM image of RuCu NSs. e) Reaction pathway of acidic OER on RuCu NSs. d,e) Reproduced with permission.[ 73 ] Copyright 2019, Wiley‐VCH. f) Schematic of the membrane‐electrode assembly with RuO2‐NS/CF as the anode. g) Long‐term stability of RuO2‐NS/CF as an anode at a large current density of 1000 mA cm−2 in PEMWE. f,g) Reproduced with permission.[ 157 ] Copyright 2021, Elsevier.
