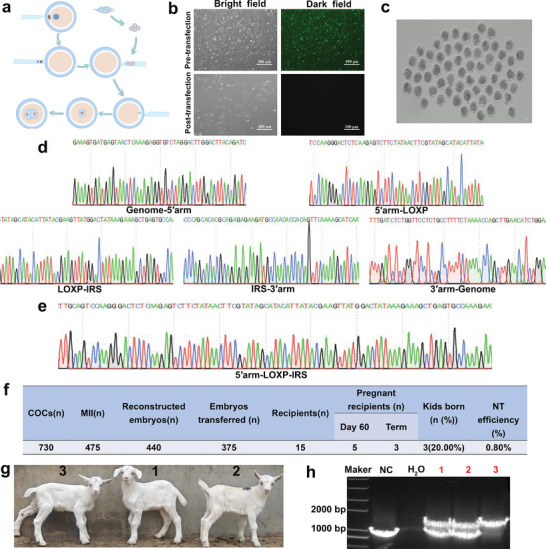
Figure 4.

Production of LYZ GED goats by SCNT. a) Schematic diagram of SCNT. b) Gene‐edited GFFs status before and after transfection with pCNDA3‐Cre vector. Scale bar: 100 µm. c) Developmental status of embryos after SCNT. Scale bar: 100 µm. d,e) Sanger sequencing results of positive monoclones with green fluorescent screening markers and without screening markers. f) Production data of GED goats. g) Three GED goats. h) Identification of GED goats.
