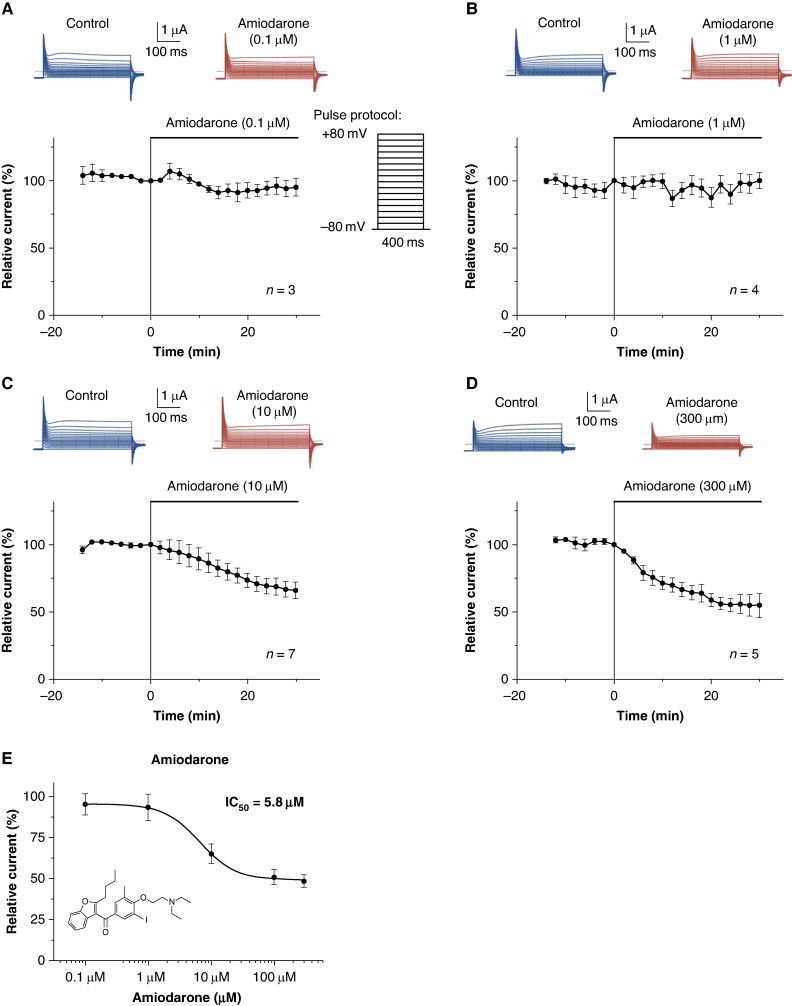
Figure 4.
Concentration–response relationship for the effect of amiodarone on SARS-CoV-2 ORF 3a proteins heterologously expressed in X. laevis oocytes. (A–E) Time course of SARS-CoV-2 ORF 3a current inhibition by amiodarone, administered in a concentration of (A) 0.1 µM, (B) 1 µM, (C) 10 µM, and (D) 300 µM. Representative macroscopic current traces elicited before (Control) and after administration of amiodarone by application of the voltage pulse protocol depicted in (A) are shown at the top of the respective panels. (E) Concentration–response relationships for the effects of amiodarone on SARS-CoV-2 ORF 3a protein-mediated currents. The mean inhibitory concentration (IC50) is provided as inset. Data are expressed as mean ± standard error of the mean from n = 3–7 cells as indicated. Dotted lines represent zero current level, and scale bars are given as insets.

