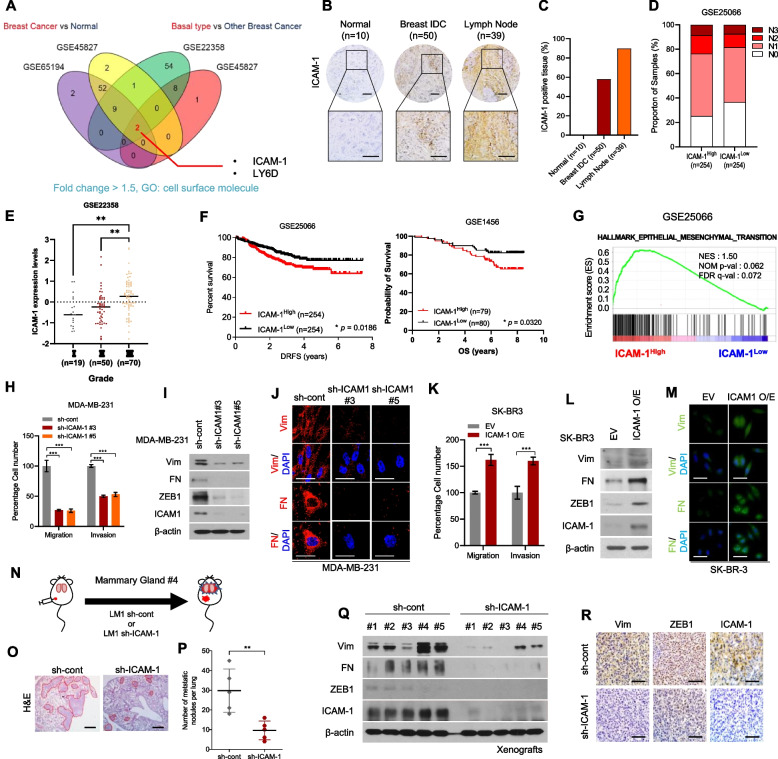
Fig. 1.
Upregulation of ICAM-1 Correlates with Poor Prognosis and Metastasis of Breast Cancer. A Expression of cell surface molecules and comparison of breast cancer tissue versus normal tissue and basal-type breast cancer patients versus other subtype breast cancer patients (GSE65194, GSE45827, GSE22358). Fold change > 1.5 (B) IHC of ICAM-1 in human breast cancer tissue array (BR1008). C IHC scoring of human breast cancer tissue array using IHC profiler. Scale bar = 200 μm. D Lymph node stage analysis using GEO dataset (GSE25066); ICAM-1High vs. ICAM-1Low. E ICAM-1 expression levels in three different grades of breast cancer patients (GSE22358). F Kaplan–Meier survival analysis of breast cancer patients (GSE25066, GSE1456); ICAM-1High vs. ICAM-1Low. G GSEA of hallmark epithelial-mesenchymal transition signature in human breast cancer patients (GSE25066); ICAM-1High vs. ICAM-1Low. NES, normalized enrichment score; Nom p-val, normalized p-value; FDR q-val, false discovery rate q-value. H Transwell migration and invasion assay of MDA-MB-231 cells transduced with ICAM-1 shRNA. I Western blots of EMT markers and regulators in MDA-MB-231 cells transduced with ICAM-1 shRNA. J ICC of vimentin (Vim) and fibronectin (FN) in MDA-MB-231 cells transduced with ICAM-1 shRNA. Scale bar = 20 μm. K Transwell migration and invasion assay of SK-BR3 transfected with ICAM-1 or control empty vector. L Western blots of EMT markers and regulators in SK-BR3 transfected with ICAM-1 or control empty vector. M ICC of vimentin (Vim) and fibronectin (FN) in SK-BR3 transfected with ICAM-1 or control empty vector. Scale bar = 20 μm. N Schematic illustration of animal experiments. O, P H&E staining (O) and the number of metastatic nodules (P) of lung in LM-1sh−cont or LM-1sh−ICAM−1 orthotopic xenograft mice. Scale bar = 200 μm. Q, R Western blots (Q) and IHC (R) of EMT markers, regulators, and ICAM-1 in LM-1sh−cont or LM-1.sh−ICAM−1 orthotopic xenograft tumors. Scale bar = 100 μm. Data are presented as mean ± SD and analyzed using one way ANOVA or Student’s t-tests. n.s, non-significant; *, p < 0.05; **, p < 0.01; ***, p < 0.001

