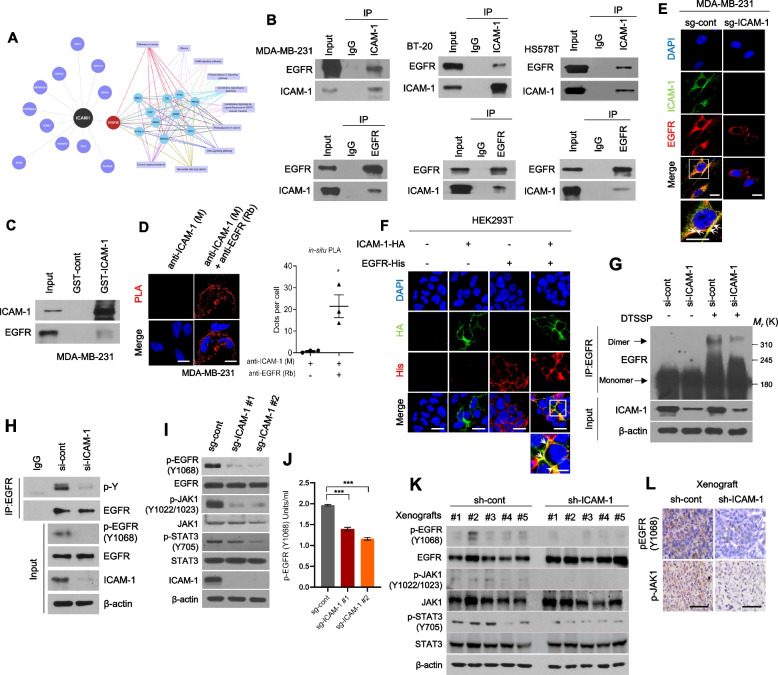
Fig. 2.
ICAM-1 directly interacts with EGFR and promotes its activation in breast cancer. A Analysis of identified ICAM-1 interactors using Cytoscape. ICAM-1 interactors were detected using MS and cell surface molecules were selected. B Co-IP with ICAM-1 or EGFR antibody and western blot to evaluate the interaction between ICAM-1 and EGFR in basal-type breast cancer cell lines. C GST pull-down assay in MDA-MB-231 cells. D Representative images and quantification of in situ PLA showing the interaction between ICAM-1 and EGFR in MDA-MB-231 cells. Scale bar = 20 μm. E ICC of ICAM-1 and EGFR in MDA-MB-231 cells. Scale bar = 20 μm. F ICC of HA tag and His-tag in HEK293T cells transfected with either ICAM-1-HA or EGFR-His, or co-transfected with both. Scale bar = 20 μm. G Dimerization of EGFR in MDA-MB-231 cells transfected with siRNA targeting ICAM-1 or control siRNA. H Co-IP with EGFR antibody and western blotting to evaluate the total phospho tyrosine in MDA-MB-231 cells transfected with siRNA targeting ICAM-1 or control siRNA. I, J Western blots (I) and phospho EGFR ELISA (J) of MDA-MB-231 cells transfected with sgRNA targeting ICAM-1 or control as indicated. K, L Western blots (K) and IHC (L) of phospho EGFR, phospho JAK1, and phospho STAT3 in LM-1sh−cont or LM-1.sh−ICAM−1 orthotopic xenograft tumors. Scale bar = 100 μm. Data are presented as mean ± SD and analyzed using one-way ANOVA. n.s, non-significant; *, p < 0.05; **, p < 0.01; ***, p < 0.001

