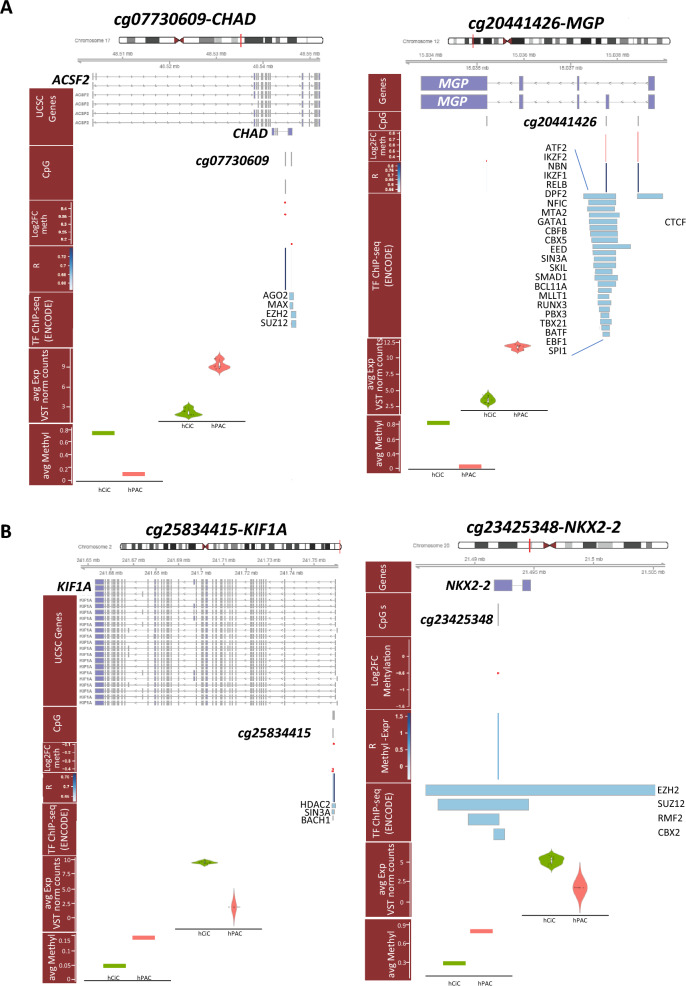
Fig. 6.
Genomic plots of selected genes. Genomic plots of selected CpG-gene pairs eligible as epigenetically modifiable target genes with mapping of genes and CpG sites, Log2FC of methylation, correlation between methylation and expression, mapping of transcription factors binding sites (ChIP-seq ENCODE) as well as differences in expression and methylation between hCiCs and hPACs. A Genomic plots of cg07730609-CHAD and cg20441426-MGP with lower expressed in hCiCs relative to hPACs. B Genomic plots of cg25834415-KIF1A and cg23425348-NKX2-2 with higher expressed in hCiCs relative to hPACs

