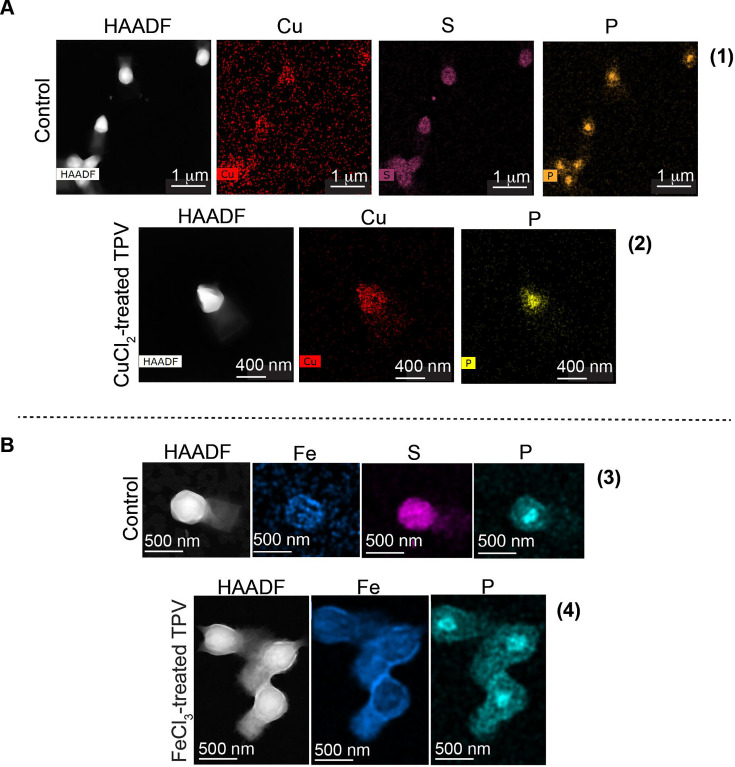
Fig 4.
Elemental distribution on TPV surface. TEM associated with energy-dispersive x-ray microanalysis of untreated TPV particles or metal-treated TPV. In these images, the density of colored dots represents the amount of the detected element. (1) Untreated TPV particles and the distribution of the following elements: copper (pink), sulfur (cyan), and phosphorous (dark yellow); (2) 10 mM CuCl2-treated TPV particles in the pre-open state. Here, copper is shown in pink and phosphorous in dark-yellow, suggesting the presence of DNA in the interior of the open capsid. (B) (3) Untreated TPV particles and the distribution of the following metals: iron (purple), sulfur (cyan), and phosphorous (dark yellow); (4) 10 mM FeCl3-treated TPV particles in the open state. Here, the iron electron cloud ghosts the structural feature of the open stargate, but cracks in the capsid are detected. For the elements, iron is shown in purple and phosphorous in dark-yellow, suggesting the presence of DNA in the interior of the open capsid. Scale bars: (A1) 1 µm, (A2) 400 nm, (B3 and B4) 500 nm. HAADF (high-angle annular dark-field imaging) images were also used to locate the particles on the grid and are the source of element detection.

