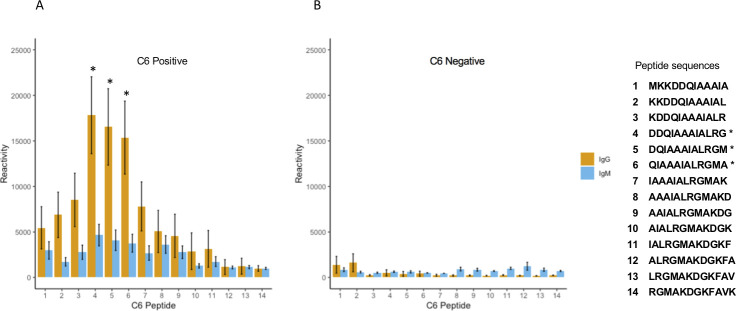
Fig 2.
IgG and IgM reactivity of individual peptides that make up the C6 fragment. Shown is the reactivity of sera from SEM-A samples. Each number on the X axis corresponds to a unique 12-mer peptide sequence displayed on the right. Panel A shows the average from 30 C6 ELISA positive samples. Panel B demonstrates the average from eight C6 ELISA negative samples. The three dominant reactive peptides are indicated with *.

