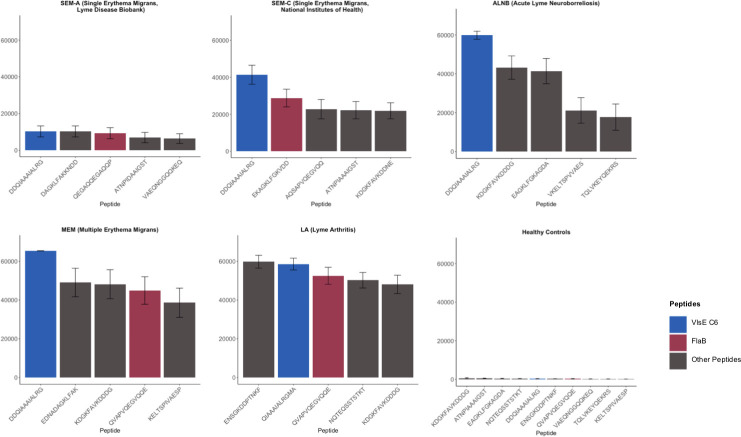
Fig 3.
List of top five reactive peptides from each Lyme disease group. A single representative peptide was selected for each reactive epitope. The C6 representative peptide are shown in blue, the FlaB peptides are shown in red; the rest of the peptides are shown in gray. The SEM-A cohort included only confirmed Lyme disease cases.

