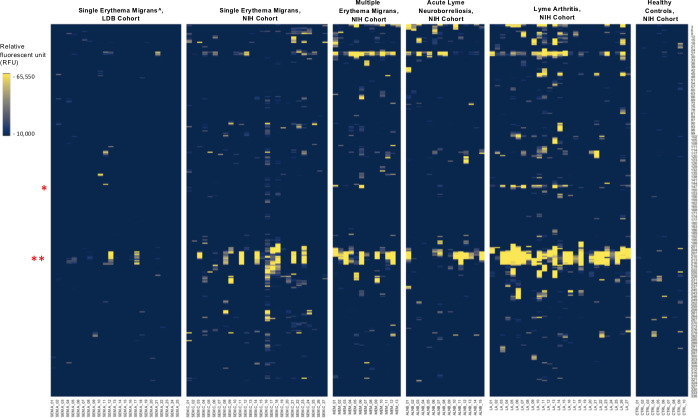
Fig 4.
IgG reactivity to FlaB peptides in the five sample types. The Y axis indicates the relative amino acid coordinates of the peptides within the full-length FlaB protein. Reactivity is shown in yellow. For clarity, only peptides with the reactivity above 10,000 RFU are shown. Samples are indicated on the X axis. To illustrate baseline reactivity, ten random normal control samples were selected and shown on the right. The red asterisks indicate the position of the key regions identified by our models. * indicates the peptides within residues 147–158; ** - indicates the highly immunoreactive region encompassing residues 207–229; ^ - includes only confirmed Lyme disease cases.

