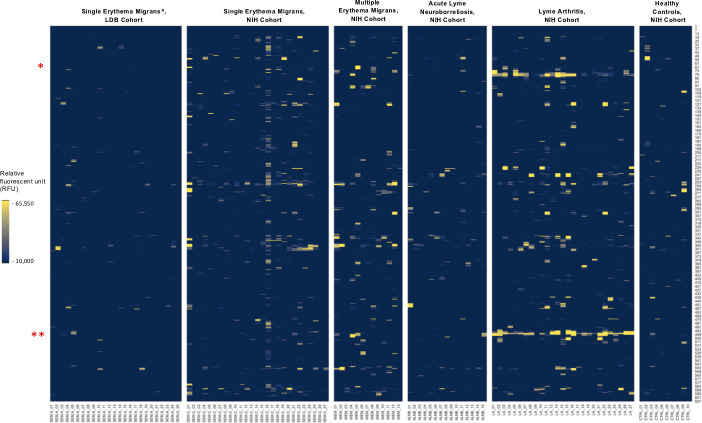
Fig 6.
IgG reactivity to p66 peptides in the five sample types. The Y axis indicates the relative amino acid coordinates of the peptides within the full-length p66 protein. The reactivity is shown in yellow. For clarity, only peptides with reactivity above 10,000 RFU are shown. Samples are indicated on the X axis. To illustrate baseline reactivity, ten random control samples were selected and shown on the right. The red asterisks indicate the position of the key peptides identified by our differential model, at position 78–90 and 497–508. ^ - includes only confirmed Lyme disease cases.

