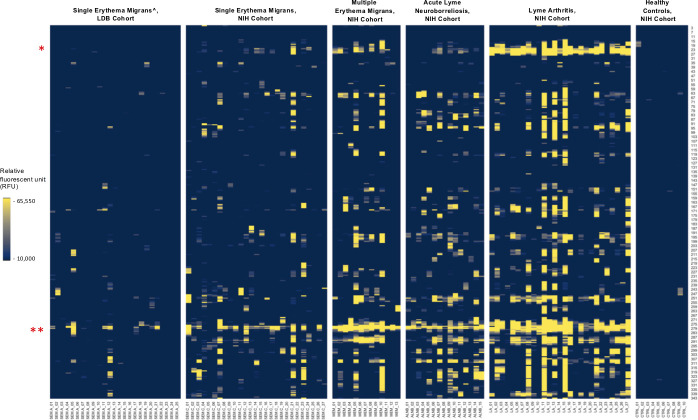
Fig 8.
IgG reactivity to VlsE peptides in the five sample types. The Y axis indicates the relative amino acid coordinates of the peptides within the full-length VlsE protein. Reactivity is shown in yellow. For clarity, only peptides with reactivity above 10,000 RFU are shown. Samples are indicated on the X axis. To illustrate baseline reactivity, ten random control samples were selected and shown on the right. The asterisks indicate the regions encompassing the peptides within aa 18–38 (*) and the C6 (**). ^ - includes only confirmed Lyme disease cases.

