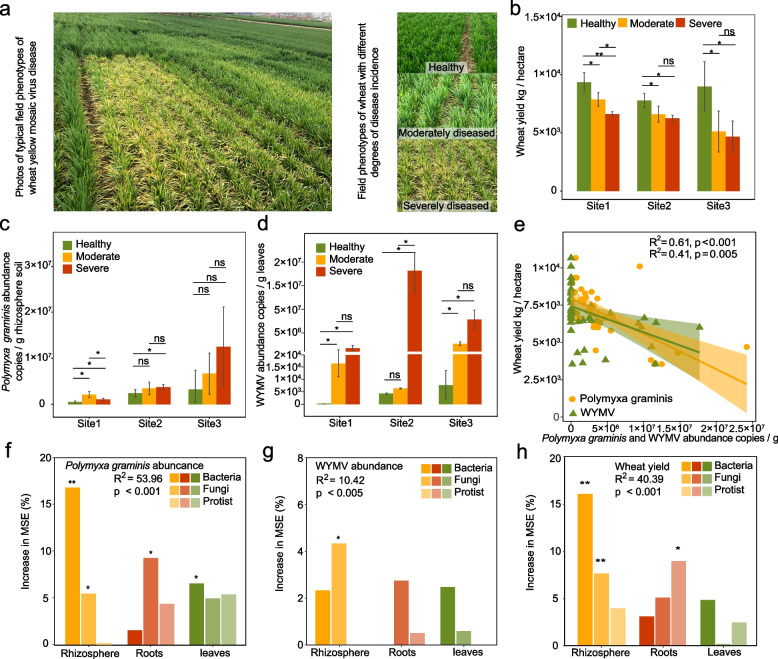
Fig. 2.
Wheat yield, the abundance of P. graminis in wheat rhizosphere, the WYMV load in wheat leaves under different disease severities, and their correlation with plant-associated microbiomes. a Field phenotype of wheat yellow mosaic disease. b Wheat yield under different disease severities in Shandong (site 1), Jiangsu (site 2), and Henan (site 3). (c) The abundances of P. graminis in wheat rhizosphere under different disease severities at the three sites. d WYMV loads in wheat leaves under different disease severities at the three sites. Single and double asterisks indicate significant differences between healthy, moderately diseased, and severely diseased wheat plants at 1% and 5% levels (Student’s t-test); ns no significant differences between healthy, moderately diseased, and severely diseased wheat plants at the 5% level (Student’s t-test). The number of samples per replicate is five, and error bars represent standard deviations. e Correlations between the abundances of P. graminis in wheat rhizosphere, the loads of WYMV in wheat leaves and wheat yield. f–h The importance of bacterial, fungal, and protozoal communities in different wheat compartments for the prediction of P. graminis abundance, WYMV load, and wheat yield. Single and double asterisks indicate significance at 5% and 1% levels. Increase in MSE (%) means the percentage of increase of mean square error. A higher value of increase in MSE (%) indicates the more important of predictors

