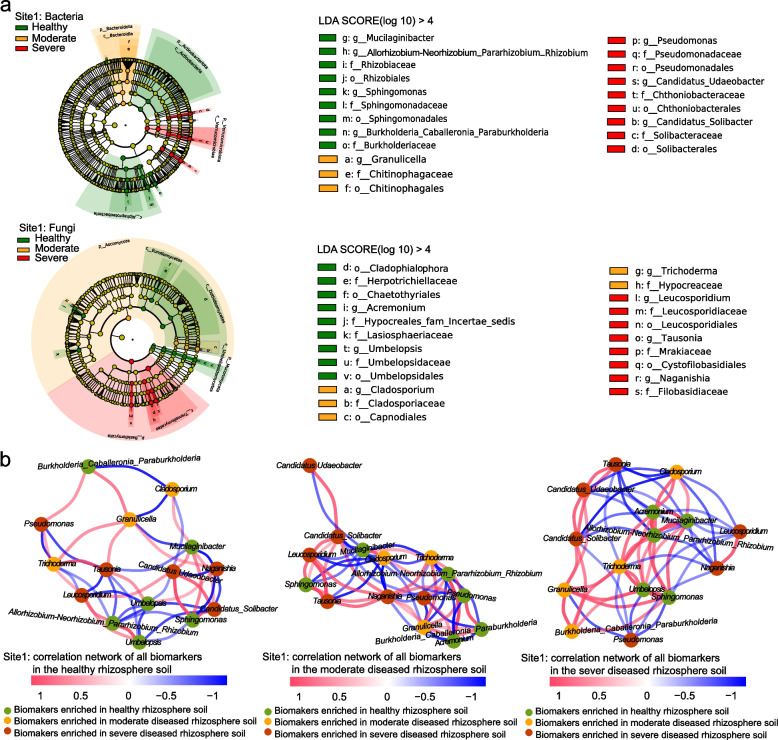
Fig. 3.
Bacterial and fungal biomarkers in the healthy, moderately diseased, and severely diseased rhizospheres in Shandong (site 1) and their correlation networks. a The linear discriminant analysis effect size (LEfSe) analysis showing the significantly different bacterial and fungal taxa (biomarkers) among the different disease severities (LDA > 4 and p < 0.05). These taxa are symbolized by colored dots. From outside to inside, the five rings of the cladogram denote the phylum, class, order, family, and genus level, respectively. b Correlation networks of biomarkers in healthy, moderately diseased, and severely diseased rhizospheres (|r|> 0.6, p < 0.05). The color of each node represents the biomarkers (at the genus level) in healthy (green), moderately diseased (yellow), and severely diseased (red) rhizospheres. Red lines represent positive correlations, and blue lines represent negative correlations

