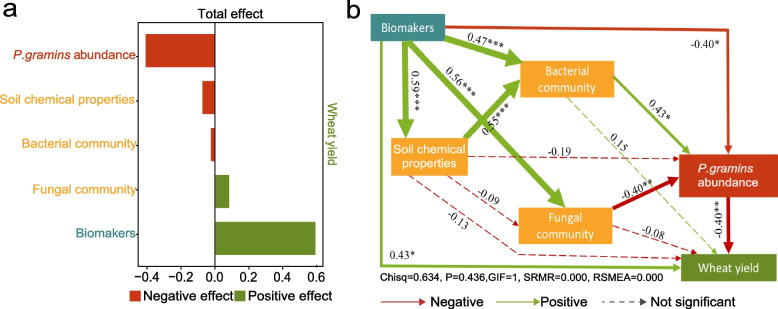
Fig. 5.
The effects of the biomarkers, soil microbial communities, soil chemical properties, and P. gramins abundance in wheat rhizosphere on wheat yield. a Standardized total effect of the biomarkers, soil microbial communities, soil chemical properties, and abundance of P. gramins in wheat rhizosphere on wheat yield. b The structural equation model showing the relationship between the biomarkers (indicated by the normalized abundances of the top 10 biomarkers), soil microbial communities (indicated by the richness, PCoA1 of the PCoA analysis, and the normalized abundances of the top 10 bacterial and fungal phyla), soil chemical properties, and abundance of P. gramins in wheat rhizosphere and wheat yield. Solid arrows indicate significant impacts, while dotted arrows indicate non-significant impacts. Green lines indicate positive impacts, and red lines indicate negative impacts. The width of the arrow represents the strength of the significantly standardized path coefficient. Single, double, and triple asterisks indicate significance at 5%, 1%, and 0.1%, respectively

