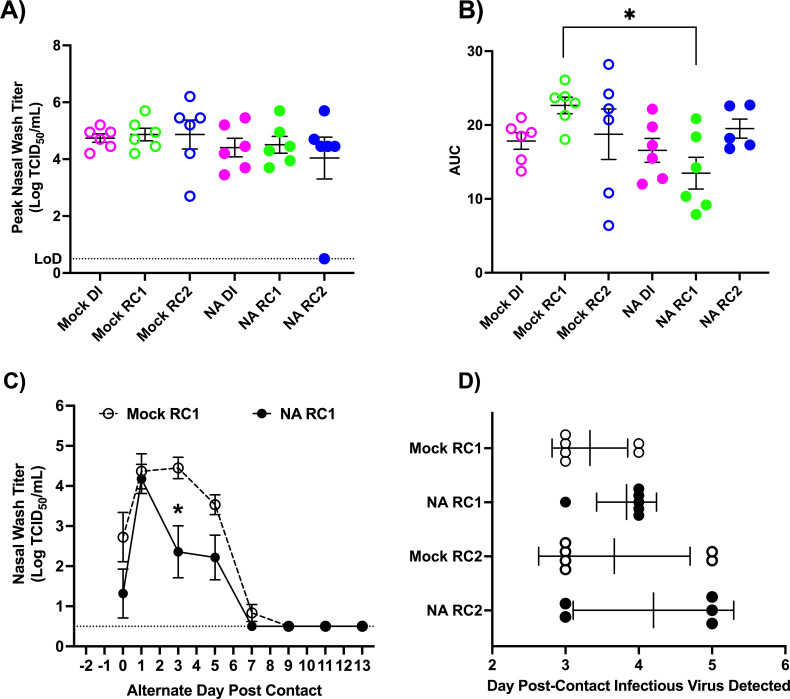
Fig 4.
Analyses of viral shedding kinetics for transmission chain experiments using mock- and NA-vaccinated RC1 ferrets. To determine if vaccine-induced NA immunity altered viral shedding kinetics several analyses were performed. Shown in (A) and (B) are peak nasal wash titers and total viral shedding assessed by area under the curve analysis for ferrets in each experimental group, respectively. To assess if NA immunity altered the progression of viral replication, in (C), viral shedding curves for Mock RC1 and NA RC1 ferrets were overlaid with day 0 being the first-day vRNA was detected in the nasal wash. Shown are average titers at each timepoint in each group. Panel (D) displays days post-contact that ferrets in Mock RC1, NA RC1, Mock RC2, and NA RC2 groups began shedding virus after respiratory contact exposure to an infected animal. *significantly different P < 0.05.

