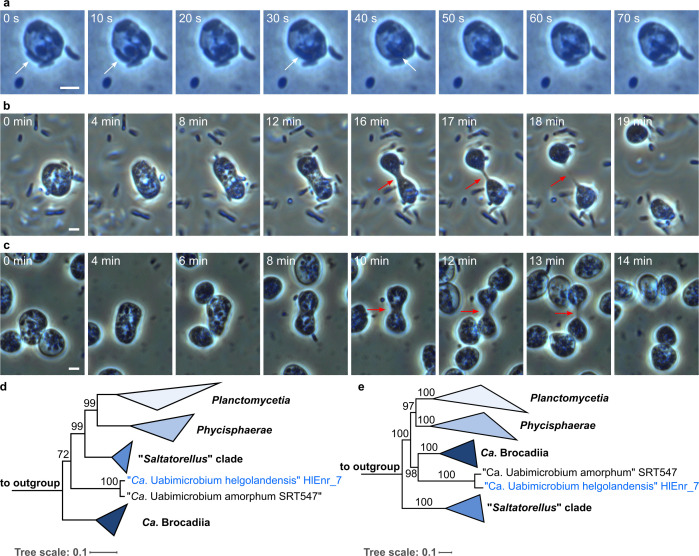
Fig 1.
Overview on the cell biology and phylogeny of “Ca. U. amorphum” SRT547 as well as the novel isolate “Ca. U. helgolandensis” HIEnr_7. Phagocytosis-like uptake of surrounding prey bacteria by “Ca. U. amorphum” (large cell) (a); white arrows indicate the prey bacterium being internalized. Cell division of “Ca. U. amorphum” (b), and “Ca. U. helgolandensis” HlEnr_7 (c). Two opposite cell poles move apart until only a thin, thread-like connection remains (red arrows) that finally disrupts. 16S rRNA gene sequence- (d) and multi-locus sequence analysis (MLSA)- (e) based phylogenies showing the deep branching of the “Ca. Uabimicrobium” clade within the phylum Planctomycetota.

