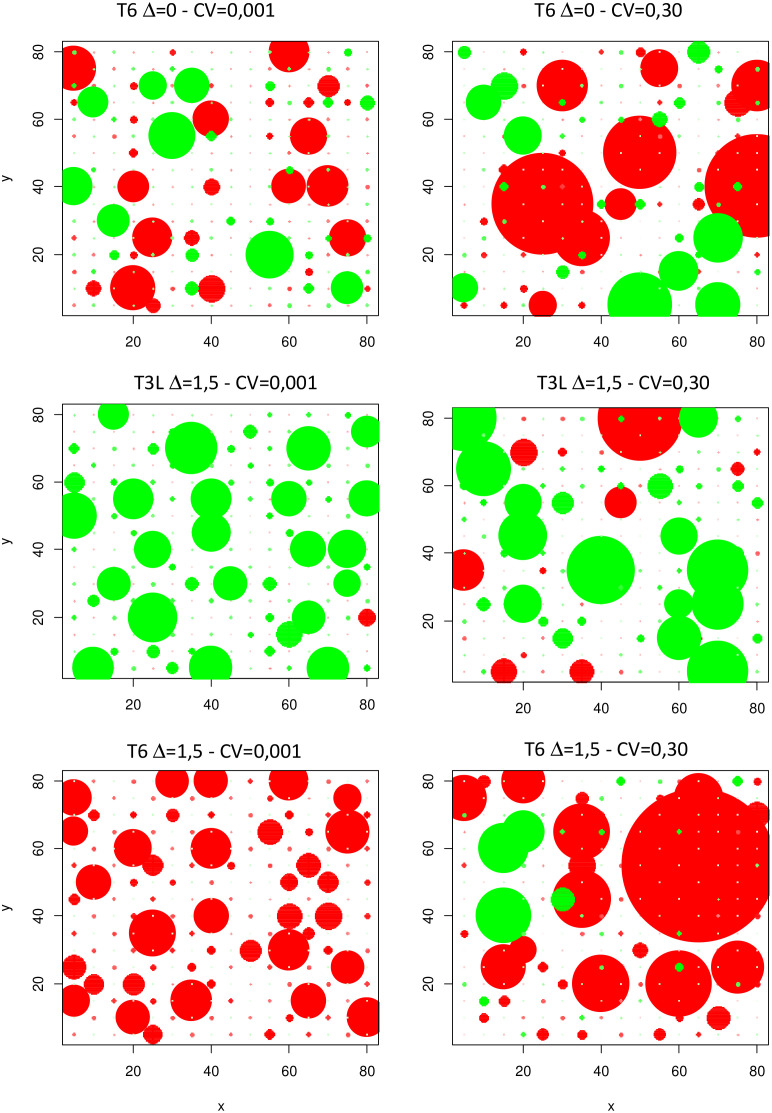
Figure 7.
Spatial distribution of individual plant biomasses for Sp.1 (red circles) and Sp.2 (green circles) in three contrasting communities at low (CV=0.001) and high (CV=0.3) IV levels. Dot areas are proportional to plant biomass at the end of the simulations. Examples are for single run simulations under 0N.

