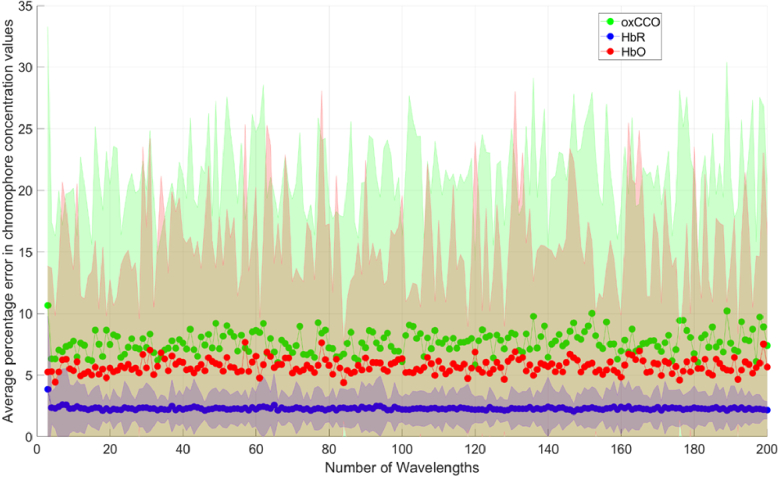
Fig. 4.
Percentage error in chromophore concentration changes against number of measurement wavelengths for ideal conditions (zero error in DPF and □ values, zero noise) for Model 1. Wavelength combinations are evenly spread across the 700-900 nm range. The shaded area denotes the standard deviation across a total of 1,000 iterations.

