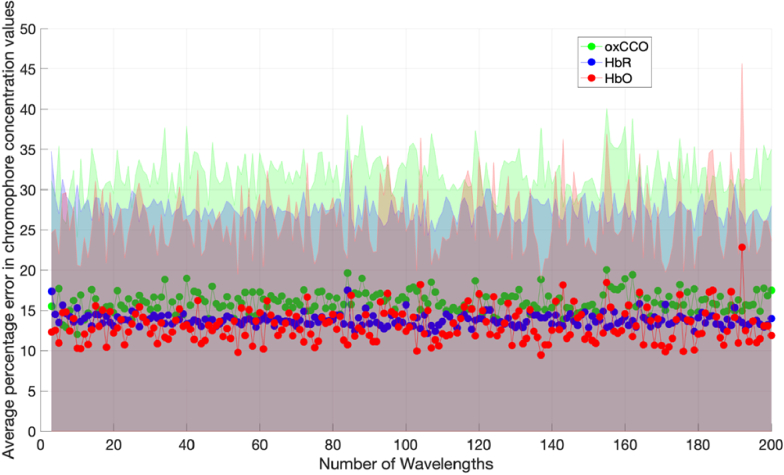
Fig. 8.
Errors in chromophore concentration changes against number of measurement wavelengths using two different ε datasets on Model 1. Wavelength combinations are evenly spread across the 700-900 nm range. Input values of ε to the simulation were generated by the Homer2 software using values compiled by Prahl (oxCCO values originated from an animal study in 198 [34]). Values of ε used to calculate concentration changes via the MBLL were taken from Cope 199 [47].

