Fig. 1.
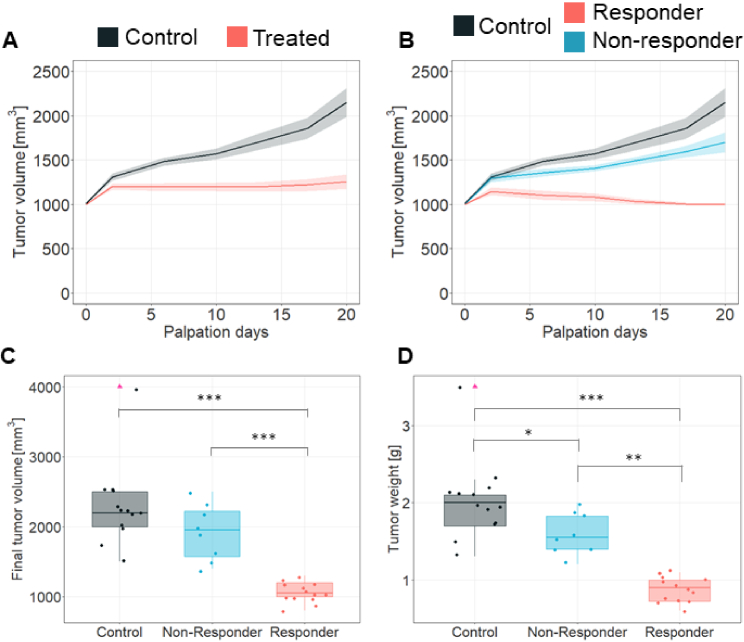
Effects of sunitinib treatment in REN108 RCC PDX tumor. A. Tumor volume progression measured by palpation in REN108 RCC orthotopic xenografts tumors. Solid lines represent the mean tumor volume over time whereas the ribbon area denotes the standard error of the mean (SEM). n = 13 controls and 22 treated animals. B. Tumor volume progression measured by palpation in REN108 RCC orthotopic xenograft tumors. According to the therapy response, mice were classified in controls (black line), responders (red line) and non-responders (blue line). Solid lines represent the mean tumor volume over time whereas the ribbon area denotes the 95% confidence interval (CI). n = 13 controls, 14 responders and 8 non-responders animals. C. Final tumor volume and D. Tumor weight measured at sacrifice. Data from n = 13 controls, 14 responders and 8 non-responder animals. Medians and IQR for each group and parameters are shown. Mann-Whitney-Wilcoxon rank sum test are shown with * for p ≤ 0.05, ** for p ≤ 0.01 and *** for p ≤ 0.001. Pink triangles indicate outlier points.

