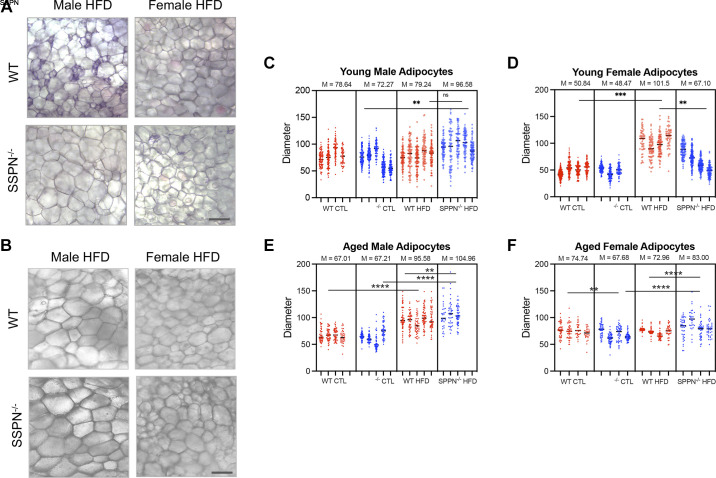
Figure 4.
Adipocyte size is altered in some sarcospan (SSPN)-deficient (SSPN−/−) mouse groups after high-fat diet (HFD). A and B: wet mount images of visceral white adipose tissue (VAT) from wild-type (WT) and SSPN−/− mice for young male and female HFD (A) and aged male and female HFD (B) mice. Scale bar indicates 50 μm. Measurements of adipocyte area were obtained as (pixels)2 using ×10 wet mount white adipose tissue images. C–F: adipocyte diameters were calculated from area measurements using d = 2r (in mm) for young males (C), young females (D), aged males (E), and aged females (F). Adipocyte diameters are shown for individual mice (n = 3–5), and mean values are reported above the graphs in C–F. CTL, control diet. Data were analyzed by 1-way ANOVA followed by Tukey’s post hoc analysis. Numbers of mice used in this study are included in Table 3 and Table 4. Significant values: **P < 0.01, ***P < 0.001, and ****P < 0.0001. ns, Not significant.

