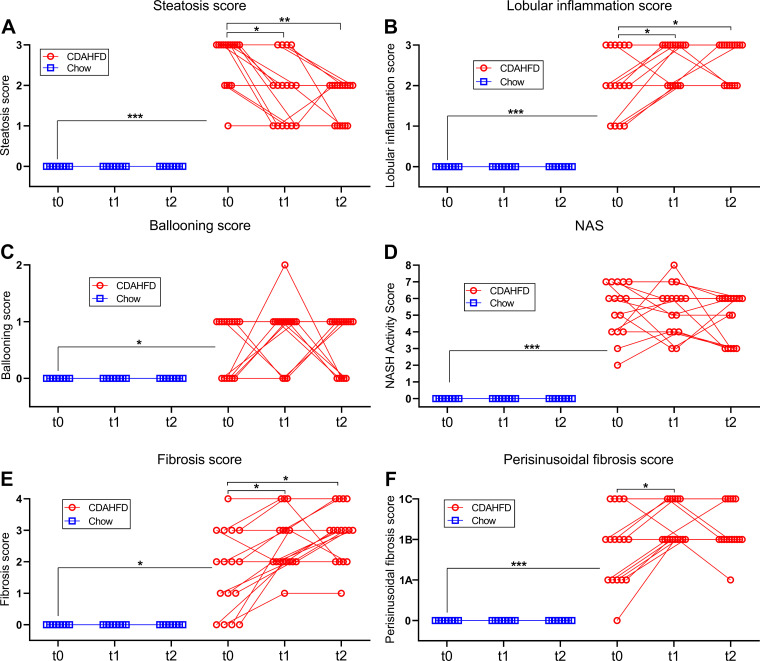
Figure 5.
MASH activity score and fibrosis score of liver samples collected in study 2 from start to end of the chow reversal period. A: steatosis score. B: lobular inflammation score. C: ballooning score. D: NAFLD activity score. E: fibrosis score. F: perisinusoidal fibrosis score. On all panels t0 = the biopsy collected right before start of the chow reversal period, t1 = the biopsy collected after 5.5 wk chow reversal and t2 = the terminal sample collected after 11 wk chow reversal. Symbols indicate observations from an individual minipig and observations from the same animal are connected with lines. *, **, and *** indicate P < 0.05, 0.001, and 0.0001, respectively, in the indicated comparisons.

